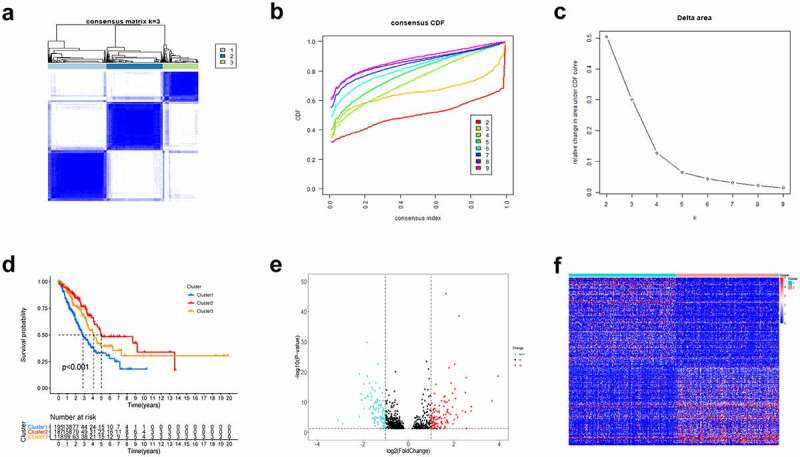
Figure 1.

Consensus Clustering identified hypoxia-related clusters of LUAD samples. (a) Consensus matrix for k = 3. (b) The CDF value of consensus index. (c) Relative change in area under CDF curve. (d) Kaplan–Meier OS survival curves for three clusters. Volcano plot (e) and heatmap (f) identifying differentially expressed hypoxia-related lncRNAs
