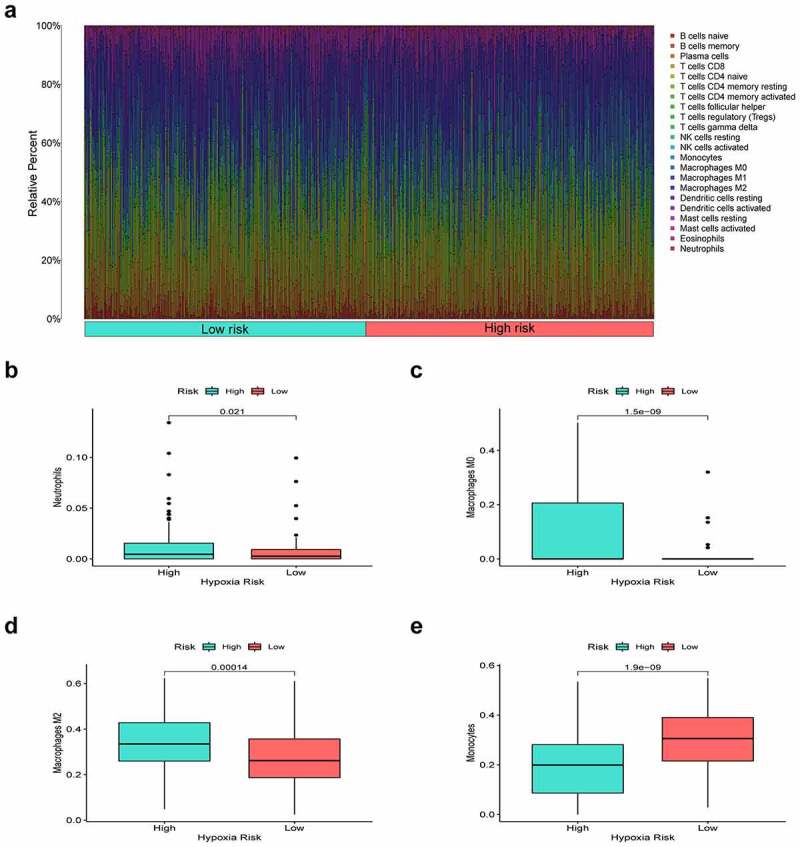
Figure 6.

Immune environment landscape between high and low-risk patients. (a) Barplot illustrating the proportion of immune cell infiltration in high and low-risk groups. (b-e) Box plots showing significantly different immune cells between high-risk and low-risk groups
