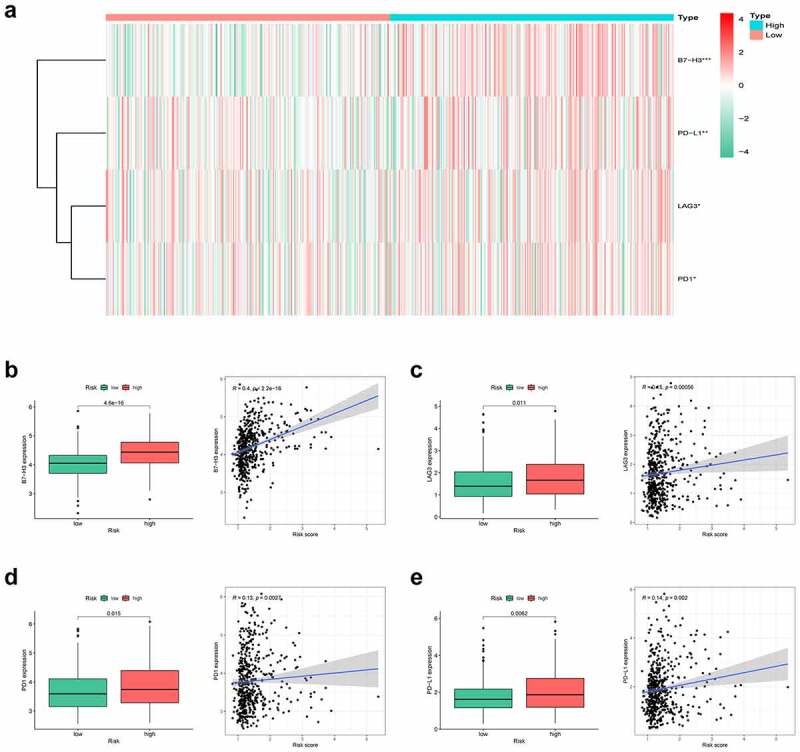
Figure 7.

Correlation analysis of risk group and immune checkpoints. (a) Heatmap of the immune checkpoint expression profiles in high-risk and low-risk groups. (b) B7H3, (c) LAG3, (d) PD1, (e) PD-L1

Correlation analysis of risk group and immune checkpoints. (a) Heatmap of the immune checkpoint expression profiles in high-risk and low-risk groups. (b) B7H3, (c) LAG3, (d) PD1, (e) PD-L1