
Figure 7.
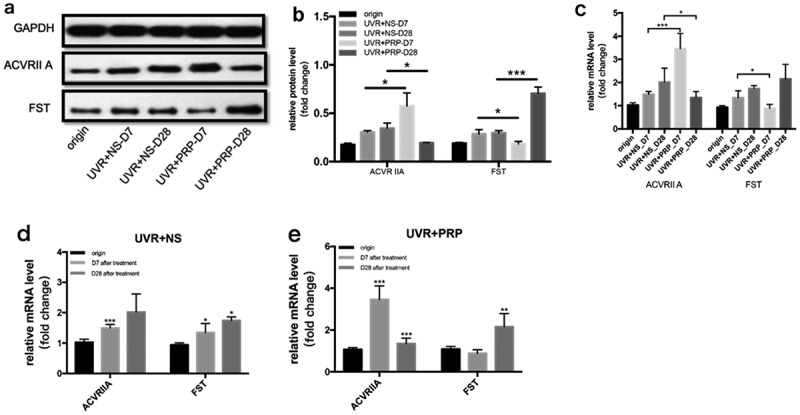
Changes of ACVR IIA and FST expression in rat skin at 7 and 28 days in NS and PRP treated group. a. Representative images of western blots of ACVR IIA and FST protein in NS and PRP treated group at different time points. b. Quantitative protein levels of ACVR IIA and FST are shown. c. The expression of ACVR IIA and FST mRNA at different points and statistical analysis between groups. *p < 0.05 and ***p < 0.001. d,e. The expression of ACVR IIA and FST mRNA at different points and statistical analysis in groups. *p < 0.05, **p < 0.01 and ***p < 0.001 vs. origin group