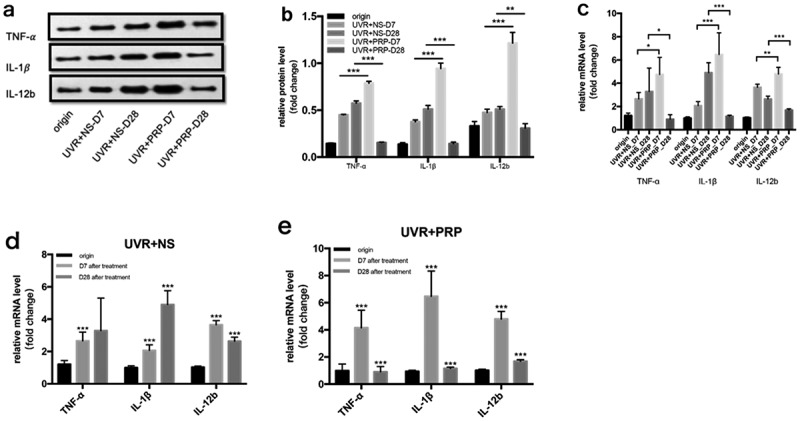
Figure 8.

Changes of TNF-α, IL-1γ and IL-12b expression in rat skin at 7 and 28 days in NS and PRP treated group. a. Representative images of western blots of TNF-α, IL-1β and IL-12b protein in NS and PRP treated group at different time points. b. Representative images of western blots of TNF-α, IL-1βand IL-12b protein in NS and PRP treated group at different time points. c. The expression of TNF-α, IL-1β and IL-12b mRNA at different points and statistical analysis between groups. *p < 0.05, **p < 0.01 and ***p < 0.001. d,e. The expression of TNF-α,IL-1γ and IL-12b mRNA at different points and statistical analysis in groups. ***p < 0.001 vs. origin group
