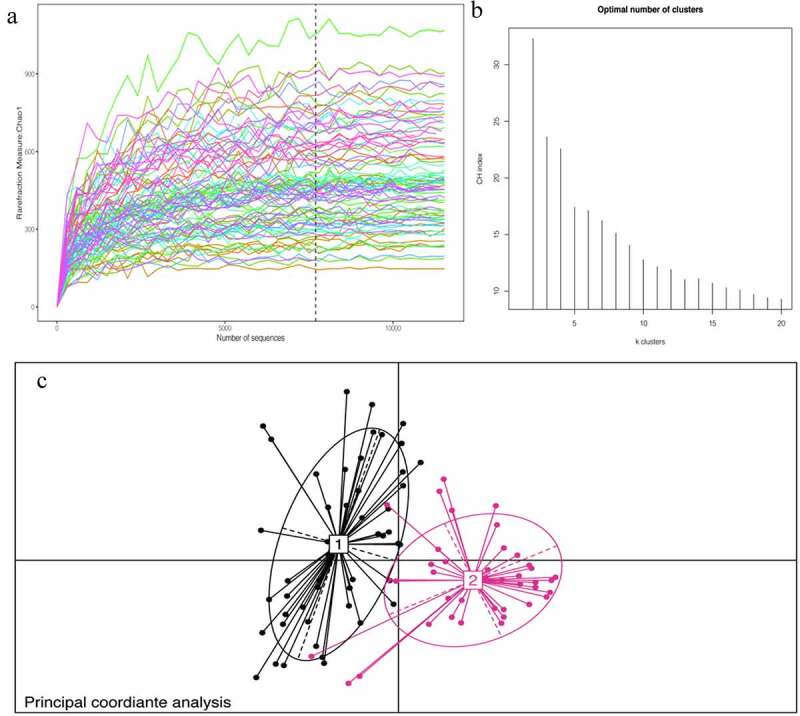
Figure 1.

A:Chao1 curves of each sample; the estimated operational taxonomic unit richness basically approached saturation in all samples.B:The number of enterotype was calculated according to CH index. C: Jensen–Shannon-based principal coordinates analysis
