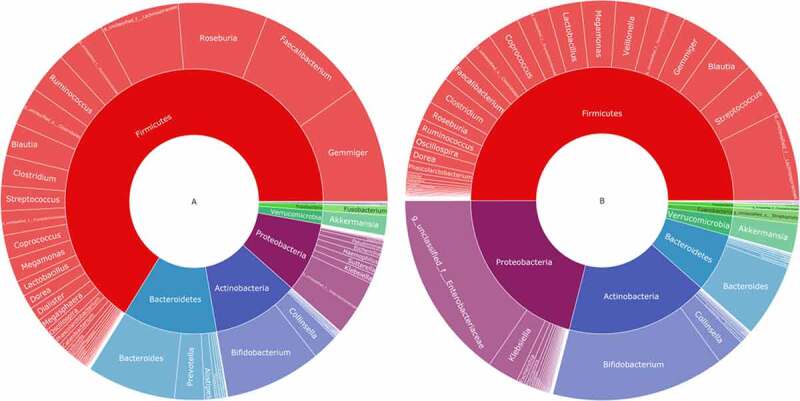
Figure 3.

Taxonomic composition of the gut microbiome according to the asymptomatic hyperuricemia and control groups. double pie chart (inner circle: phylum level, outer circle: genus level). A: the asymptomatic hyperuricemia groups; B:control groups
