Figure 4.

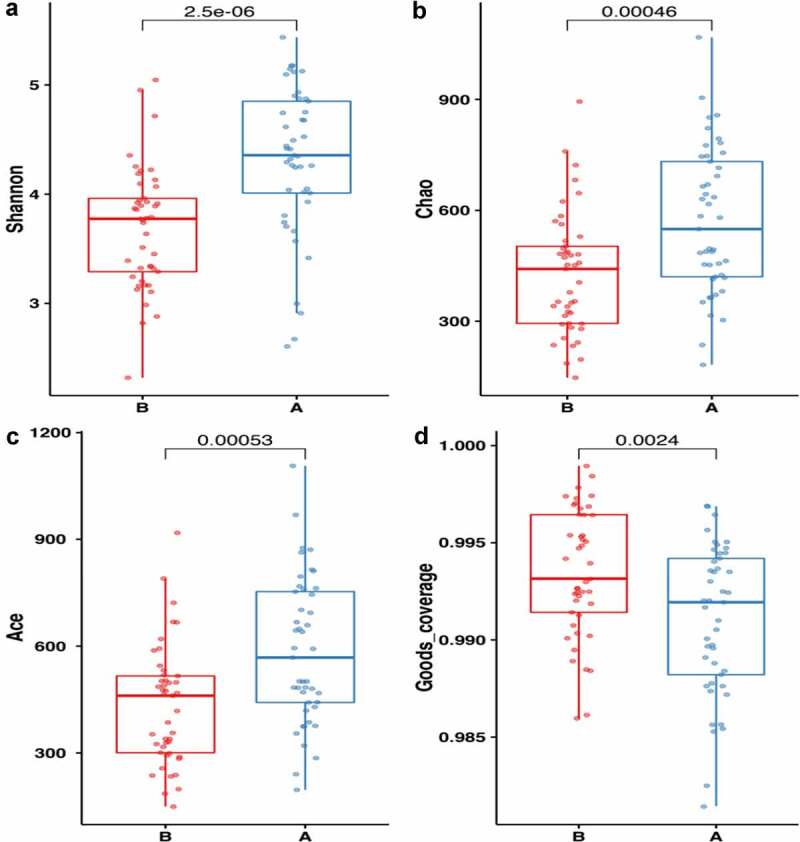
Comparison of fecal microbial diversity, as estimated by the Shannon index(a), Chao1 index(b), Ace index(c) and goods_coverage index(d). A: the asymptomatic hyperuricemia groups; B:control groups

Comparison of fecal microbial diversity, as estimated by the Shannon index(a), Chao1 index(b), Ace index(c) and goods_coverage index(d). A: the asymptomatic hyperuricemia groups; B:control groups