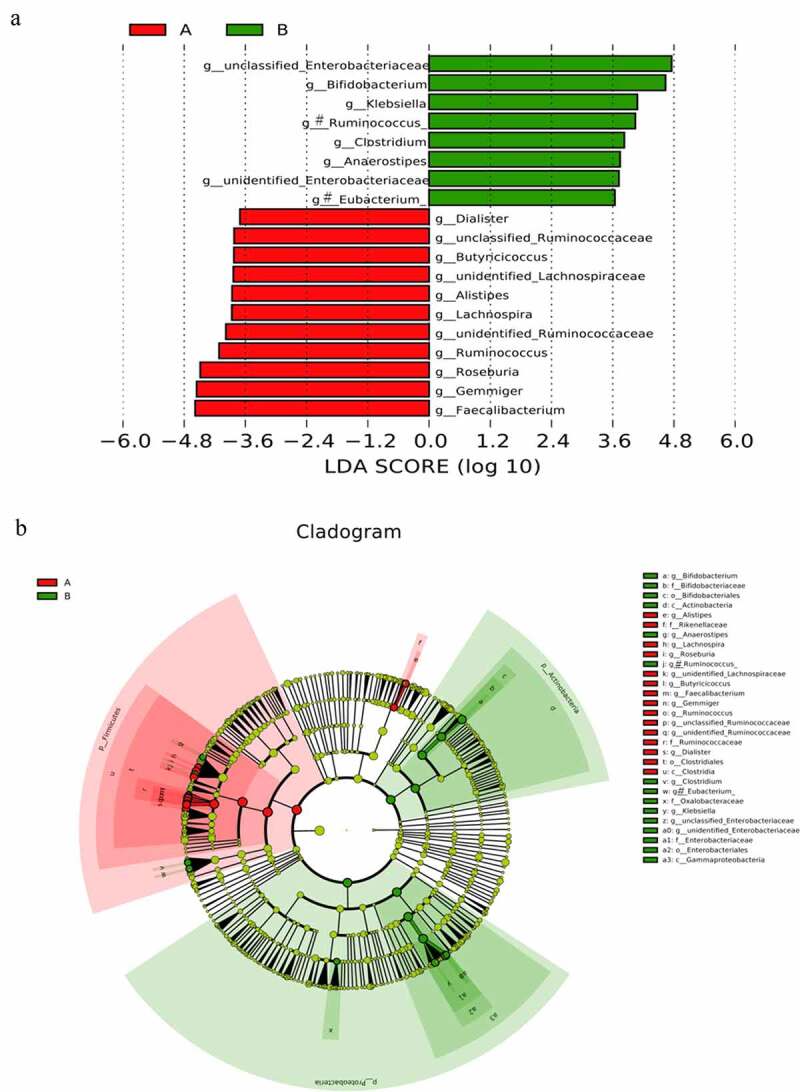
Figure 6.

(a) clustering tree showing significant taxonomic differences in the gut microbiota between AH (negative score) and control (positive score) groups through LEfSe analysis (LDA scores (log10) >3). (b) Cladogram indicating the phylogenetic distribution of the gut microbiota in AH and control groups through LEfSe analysis (LDA scores (log10) >3). AH: asymptomatic hyperuricemia; p: phylum; c: class; o: order; f: family; g: genus; LEfSe: linear discriminant analysis effect size; LDA: linear discriminant analysis. #:Tentative names in greenenes database
