Figure 1.

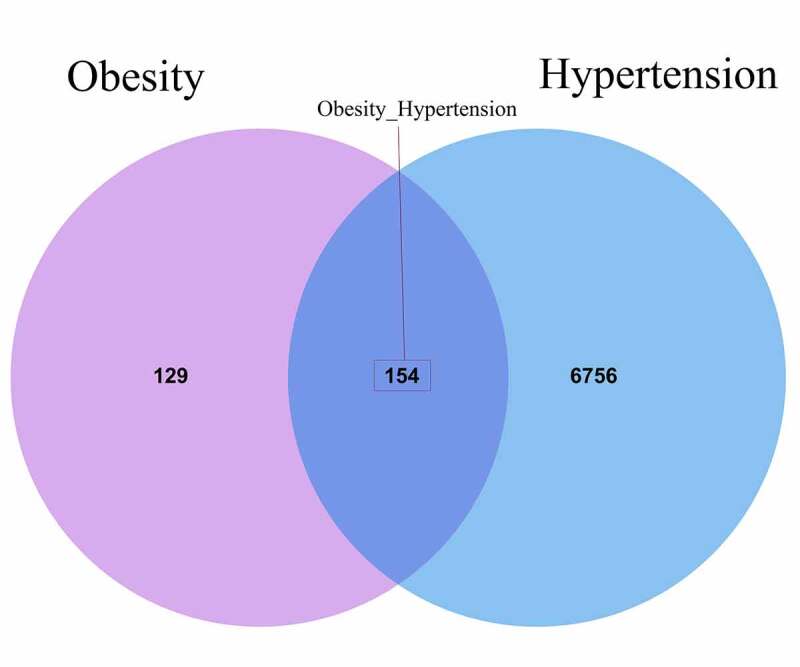
A Venn diagram showed all pathological genes both in obesity and hypertension, and total 154 interaction genes were identified accordingly

A Venn diagram showed all pathological genes both in obesity and hypertension, and total 154 interaction genes were identified accordingly