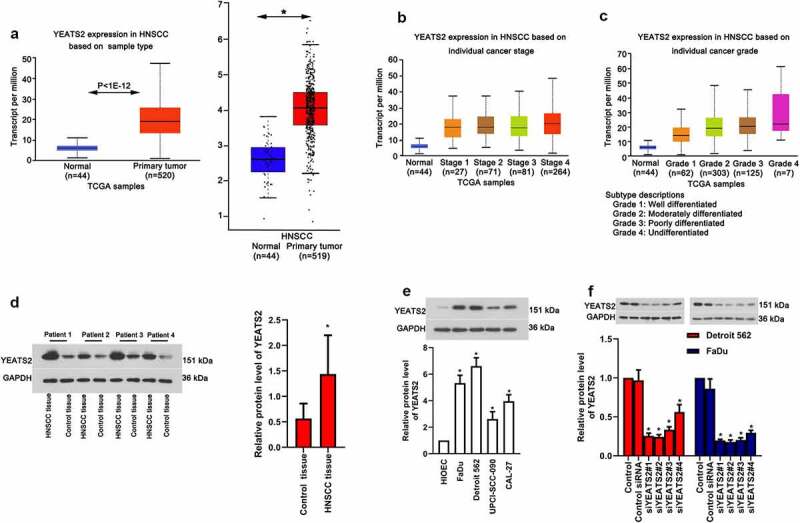
Figure 1.

Expression of YEATS2 in HNSCC tissues and OSCC cell lines. (a) Expression of YEATS2 in HNSC tissues (Data cited from GEPIA and Ualcan website). (b) Expression of YEATS2 in HNSCC based on individual cancer stages. (c) Expression of YEATS2 in HNSC based on individual cancer grade (Data cited from Ualcan website). (d) Expression of YEATS2 in obtained clinical HNSCC samples. Data were represented as mean ± SD and analyzed by paired t test (n = 17). *p < 0.05 vs. Control tissue group. (e) Expression of YEATS2 in HIOEC, FaDu, Detroit562, UPCI-SCC-090 and CAL-27 cells. Data were represented as mean ± SD at least three independent experiments and analyzed by one-way analysis of variance (ANOVA) followed by Tukey’s multiple comparison test. *p < 0.05 vs. HIOEC cell group. (f) Western blot was used to detect YEATS2 siRNA transfection efficiency in Detroit562 and FaDu cells. Data were represented as mean ± SD at least three independent experiments and analyzed by one-way analysis of variance (ANOVA) followed by Tukey’s multiple comparison test. *p < 0.05 vs. the control group
