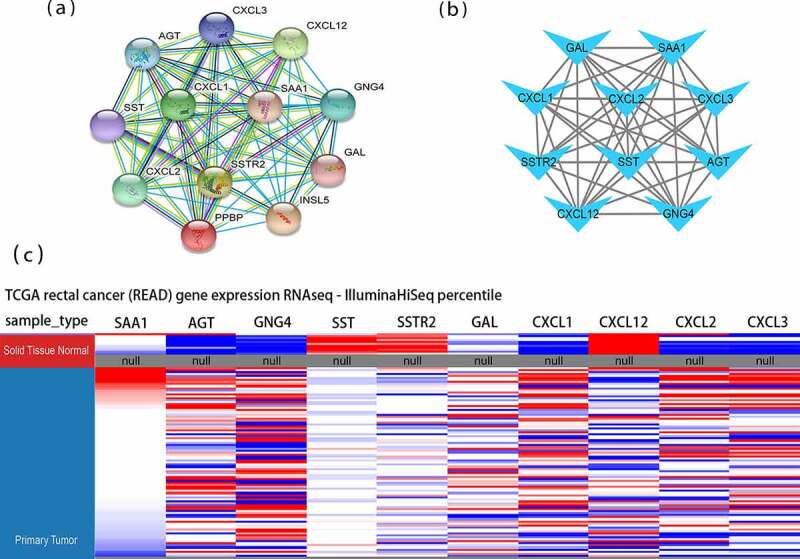
Figure 2.

Protein-protein interaction (PPI) networks and hierarchical clustering analysis of hub genes. (a) Module 1 consisted of 12 nodes and 66 edges. (b) Hub genes’ PPI network was obtained using the MCC algorithm in the cytoHubba tool kits. (c) Utilizing UCSC construct hub genes’ hierarchical clustering. Blue: up-regulated; Red: down-regulated. MCC: Maximal Clique Centrality
