. 2021 Sep 7;12(1):5932–5949. doi: 10.1080/21655979.2021.1972078
© 2021 The Author(s). Published by Informa UK Limited, trading as Taylor & Francis Group.
This is an Open Access article distributed under the terms of the Creative Commons Attribution License (http://creativecommons.org/licenses/by/4.0/), which permits unrestricted use, distribution, and reproduction in any medium, provided the original work is properly cited.
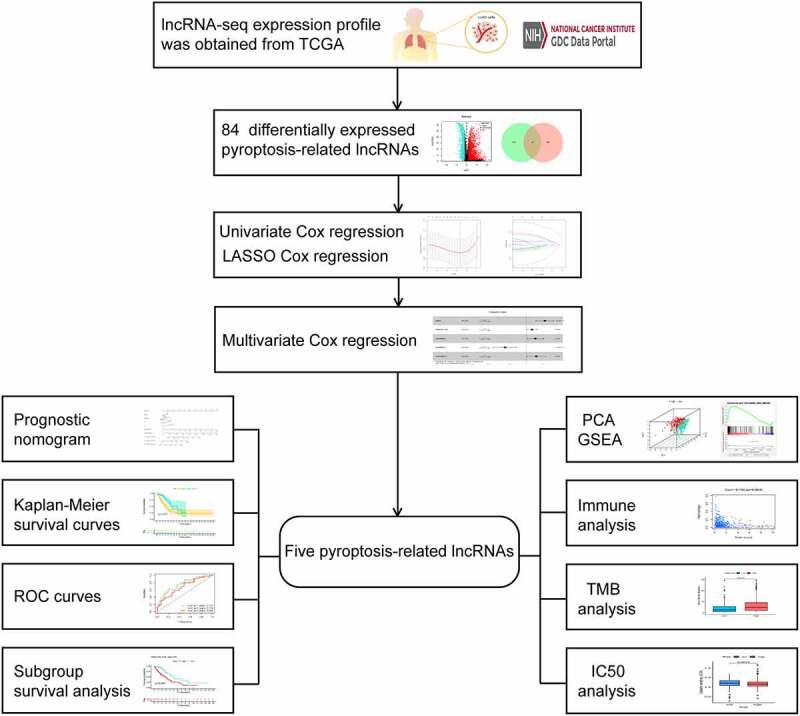
Figure 1.

Infographic flowchart of the whole study
