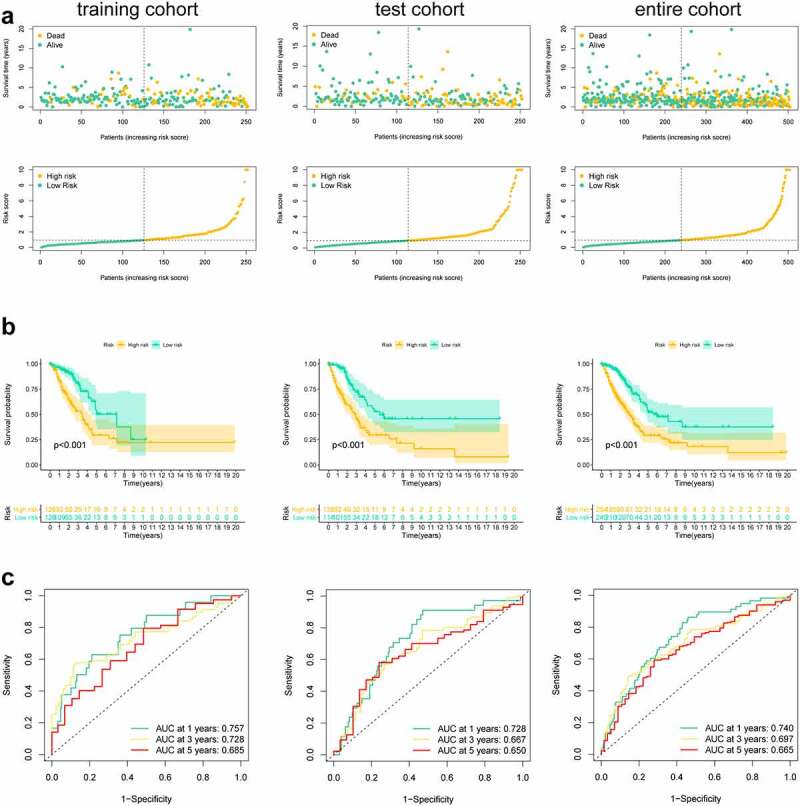
Figure 3.

Risk score of the pyroptosis-related signature for overall survival (OS). (a) Distribution of survival and (b) risk scores of high- and low-risk patients; (c) Kaplan-Meier survival curve analysis suggests that the notable difference in OS between low-risk and high-risk score group; (d) ROC analysis for verifying model performance in the prediction of LUAD survival rates at 1, 3 and 5 years in the training cohort, validation cohort and entire cohort
