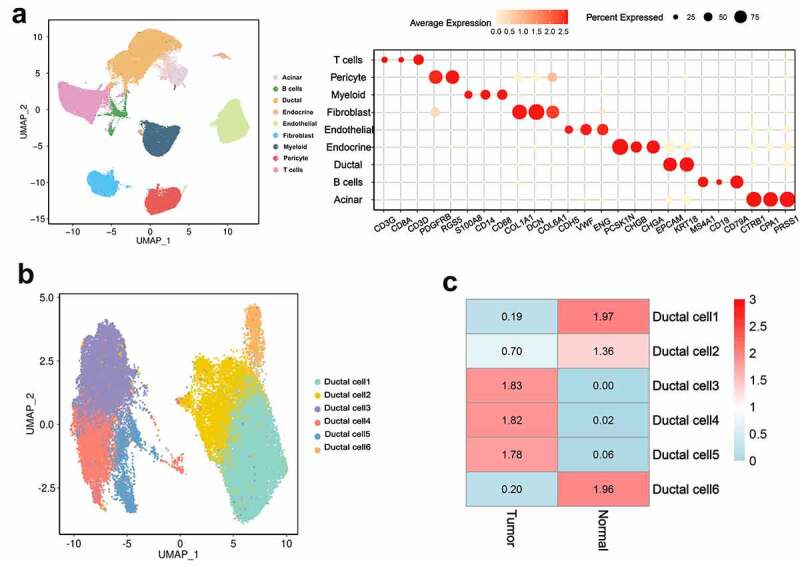
Figure 1.

ScRNA-seq analysis reveals a variety of cell types in PDAC and control pancreas
(a) UMAP displayed the main cell types (left). Representative markers across the major cell types are displayed in the bubble diagram (right).(b) UMAP displayed the diverse ductal cell types in PDAC and control pancreas.(c) Organizational contribution rate measured the difference between the ductal cell types.
