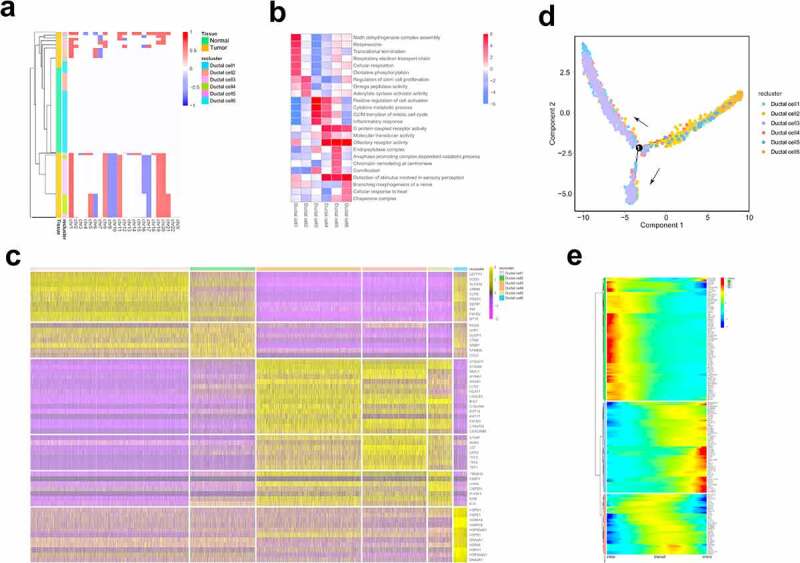
Figure 2.

ScRNA-seq analysis reveals the status and invasive trajectory of ductal cells
(a) Heatmap displaying large-scale copy number variations (CNVs) of ductal cells in PDAC and control pancreases. The normalized CNV levels are shown: red represents a high CNV level and blue represents a low CNV level.(b) Heatmap displaying the expression of specific markers in the different ductal cell types.(c) Functional enrichment analysis of genes specifically expressed in each ductal cell types.(d) Monocle 2 reveals the trajectory of ductal cells in PDAC and control pancreases. Each point corresponds to a single cell.(e) The differentially expressed genes (rows) along the pseudo-time (columns) are clustered hierarchically into three profiles. The color key from blue to red indicates relative expression levels from low to high, respectively.
