
Figure 2.
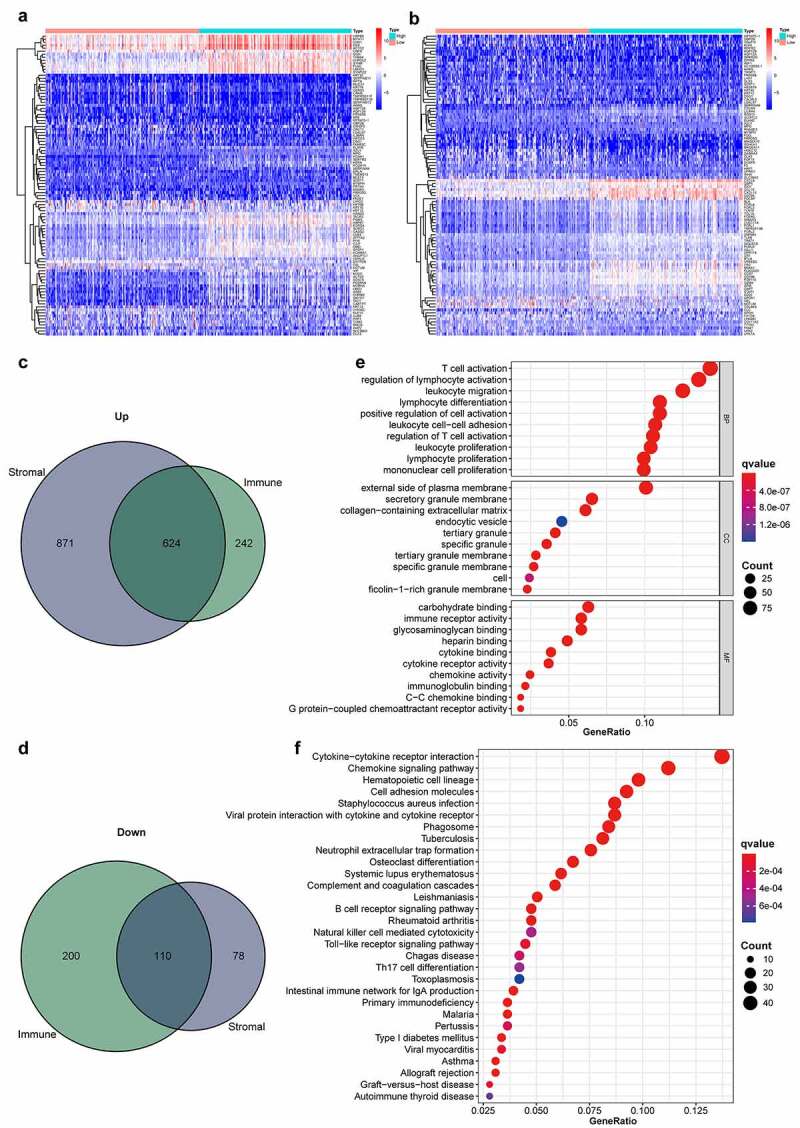
Heatmaps, Venn diagrams, and enrichment analysis of the DEGs. (2a) Heatmapped DEGs within the stromal high-scoring group versus low-scoring group (|logFC| >1; FDR < 0.05 based on Wilcoxon test); red represents higher expression and blue represents lower expression. (2b) Heatmapped DEGs in immune high-scoring group versus low-scoring group (|logFC| >1; FDR < 0.05 based on Wilcoxon test); red represents higher expression and blue indicates lower expression. (2 c) Venn diagram of 624 commonly upregulated genes (stromal/immune-linked scorings). (2d) Venn diagram of 110 commonly downregulated genes (stromal/immune-linked scorings). (2e) Ten highest-ranking GO terms for BP, CC and MF enriched using DEGs shared by stromal and immune scores (q value < 0.05). (2 f) Top 30 KEGG terms enriched by DEGs and ranked by q values from highest to lowest (q value < 0.05)