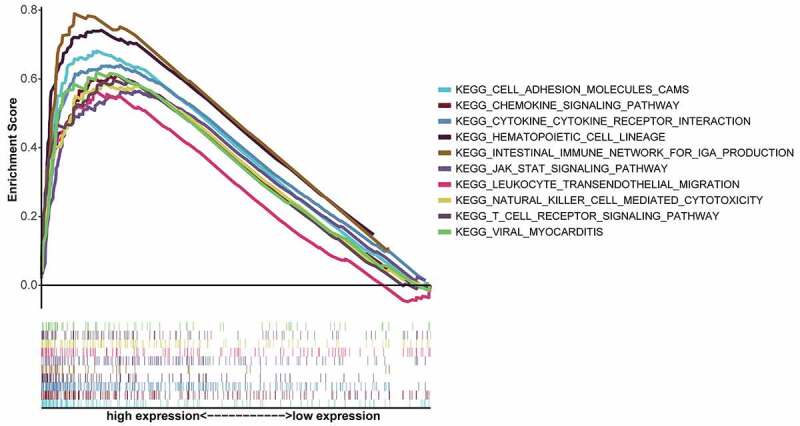
Figure 5.

GSEA of top ten KEGG pathways with the highest FDR q values for samples with high CXCR4 expression. Individual lines represent a specific KEGG pathway and associated color; left-hand-side genes were positively associated with CXCR4, and genes on the right negatively correlated with CXCR4
