
Figure 1.
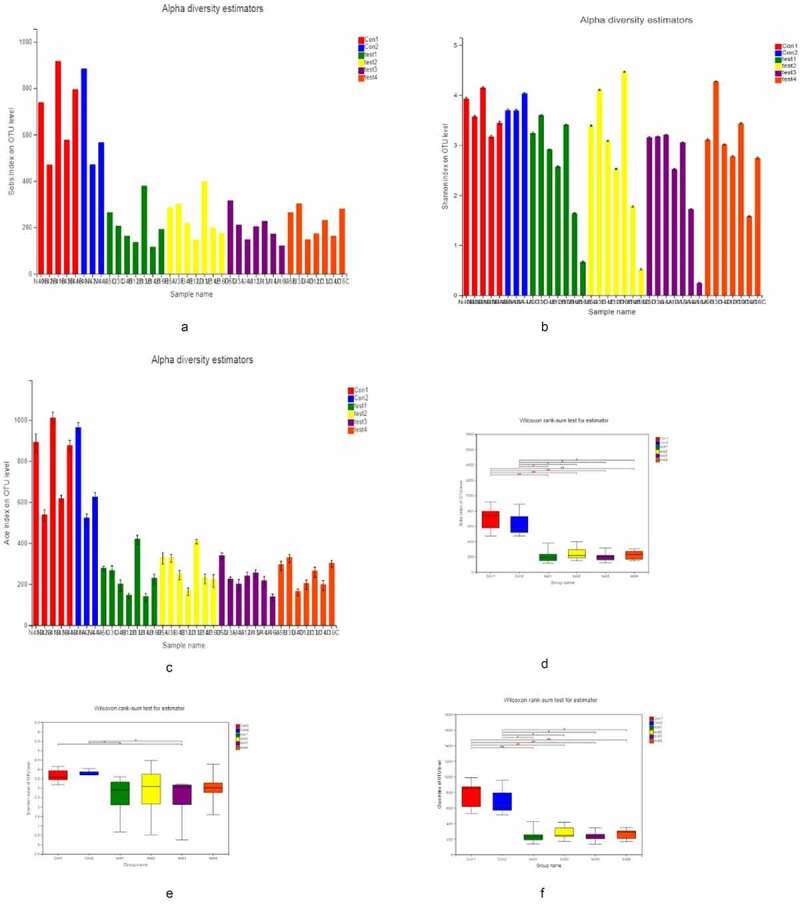
α Diversity analysis A, B, C for Sobs, Shannon, and ACE indices of UC patients and healthy control subjects at the OTU level. D, E, F for Significant differences between samples from 2 selected groups. *P < 0.05, **P < 0.01, ***P < 0.001. X and Y axes show group names and exponential averages for each group, respectively