Figure 2.

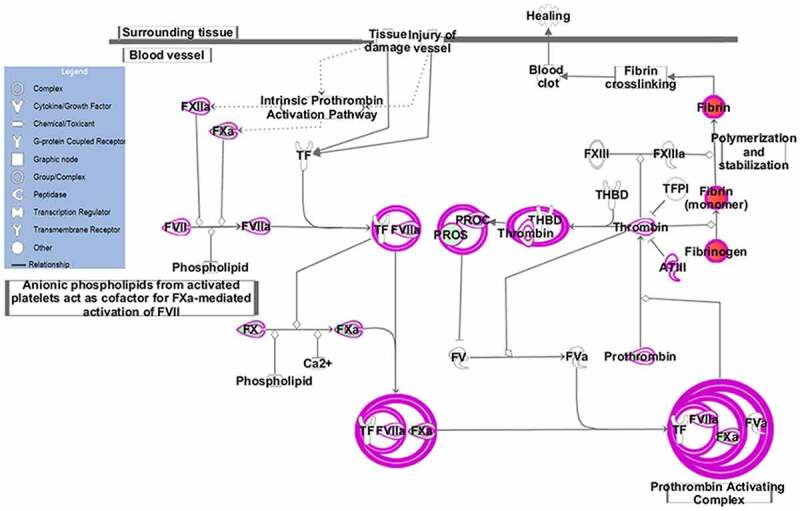
EC pathway. The EC pathway was constructed based on IPA mapping. Green represents the down-regulated proteins, red represents the up-regulated proteins and pink circles indicate the complex formed during coagulation

EC pathway. The EC pathway was constructed based on IPA mapping. Green represents the down-regulated proteins, red represents the up-regulated proteins and pink circles indicate the complex formed during coagulation