Figure 4.

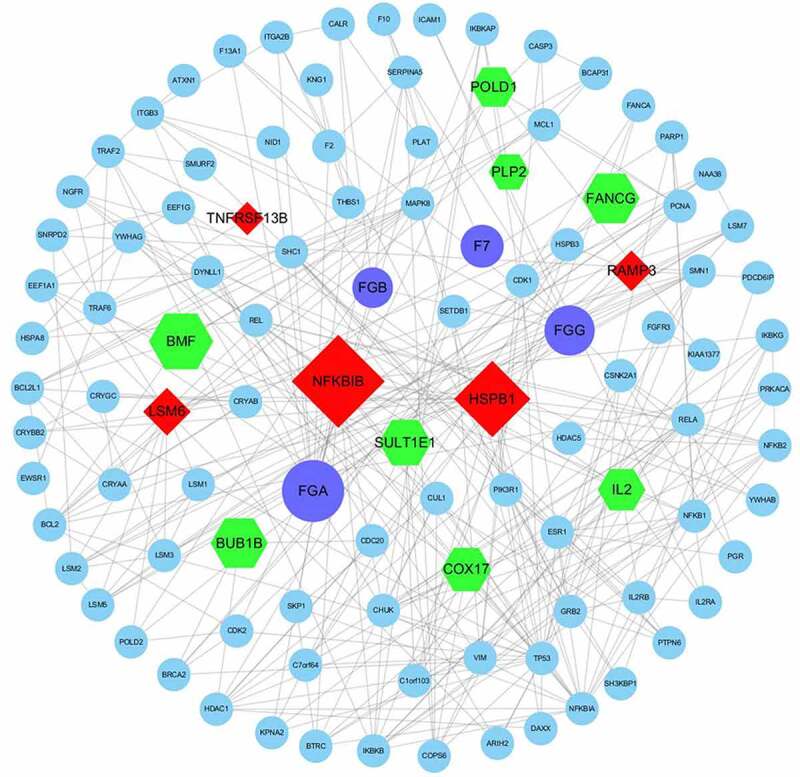
PPI sub-network obtained by Cytoscape. Purple – DEPs in the EC pathway verified by ELISA; red – upregulated DEGs; green – downregulated DEGs; blue – other proteins; lines – relationships

PPI sub-network obtained by Cytoscape. Purple – DEPs in the EC pathway verified by ELISA; red – upregulated DEGs; green – downregulated DEGs; blue – other proteins; lines – relationships