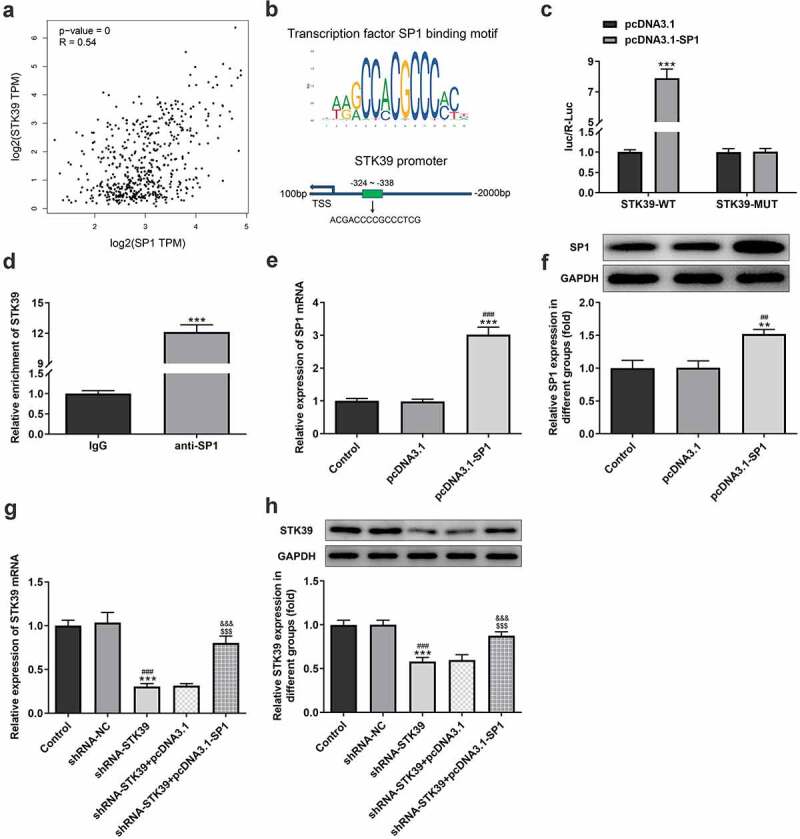
Figure 4.

The relationship between SP1 and STK39
(a,b) The expression correlation and binding sequences between SP1 and STK39 was analyzed using GEPIA database. (c) The result of dual-luciferase report assay. ***P < 0.001 vs STK39-WT + pcDNA3.1. (d) Chromatin immunoprecipitation (ChIP) assay was adopted to detect the interaction between STK39 and SP1. ***P < 0.001 vs IgG. (e-f) The transfection efficiency of SP1 overexpression in Hep3b cells. **P < 0.01 and ***P < 0.001 vs Control; ##P < 0.01 and ###P < 0.001 vs pcDNA3.1. (g,h) The mRNA and protein expression of STK39 in Hep3b cells that transfected with indicated vectors was examined with RT-qPCR and western blot assay. ***P < 0.001 vs Control; ###P < 0.001 vs shRNA-NC; $$$P < 0.001 vs shRNA-STK39; &&&P < 0.001 vs shRNA-STK39+ pcDNA3.1.
