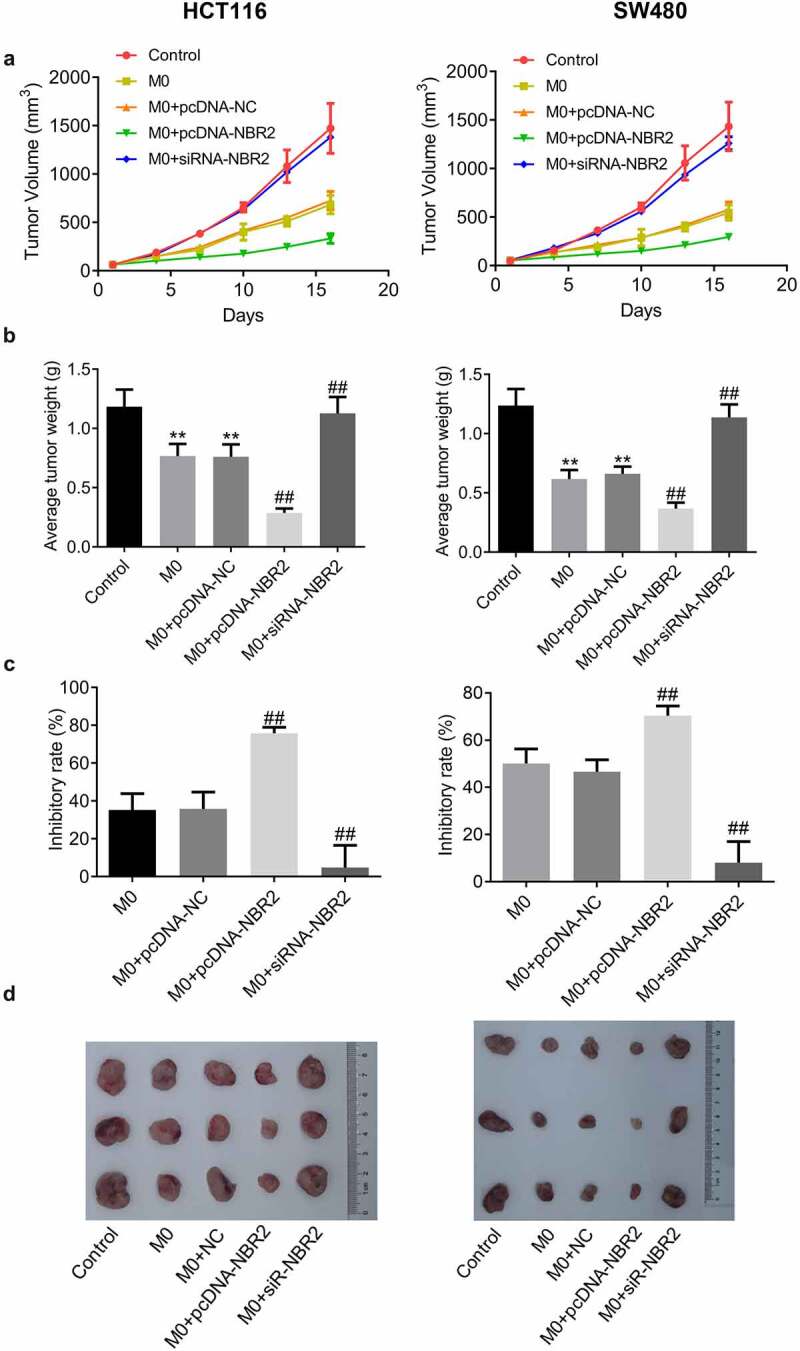
Figure 5.

The lncRNA NBR2 suppressed the tumor growth in the HCT116 and SW480 xenograft model. A) Curves of tumor volume versus injection time; B) Average tumor weight in mice (**P < 0.01, vs. Control; ##P < 0.01, vs. M0). C) The inhibitory rate of tumor growth (##P < 0.01, vs. M0). D) Photos of tumors at the end of the study
