Figure 8.

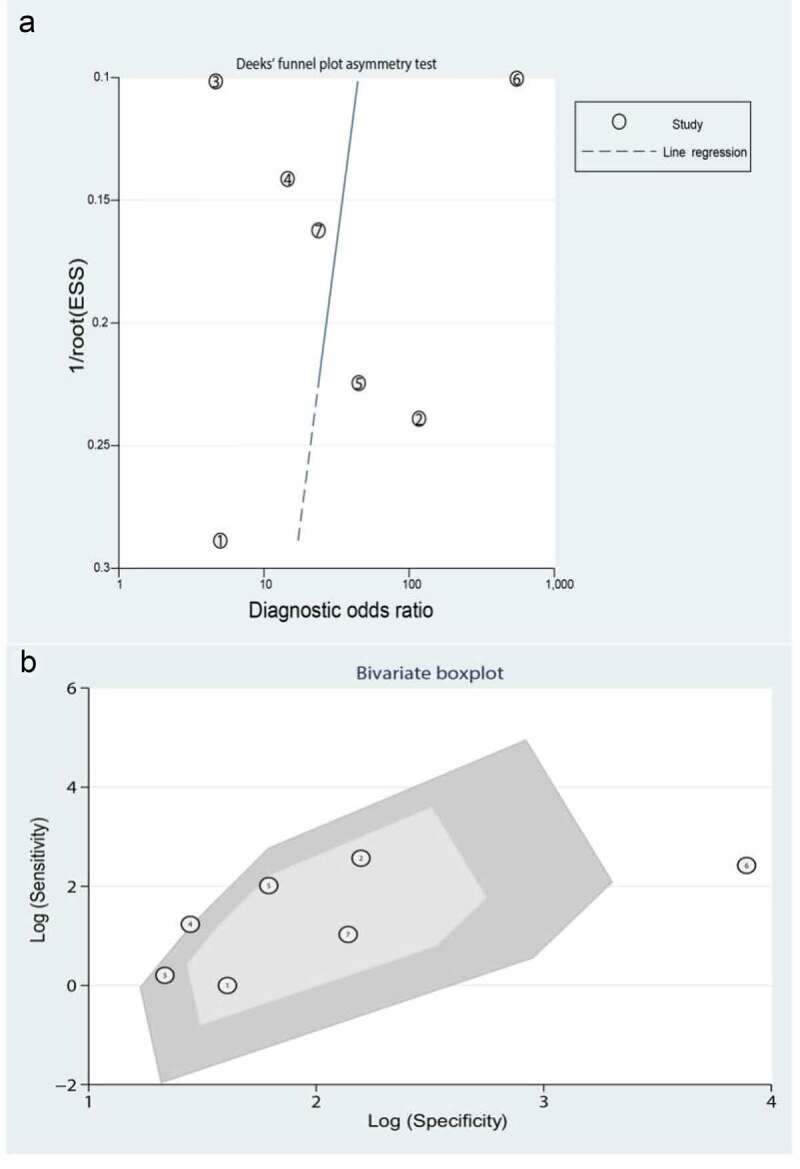
The source of heterogeneity was analyzed from the perspectives of publication bias and a bivariate box plot. (a) Deeks’ funnel plot asymmetry test for identifying publication bias. (b) Bivariate boxplot

The source of heterogeneity was analyzed from the perspectives of publication bias and a bivariate box plot. (a) Deeks’ funnel plot asymmetry test for identifying publication bias. (b) Bivariate boxplot