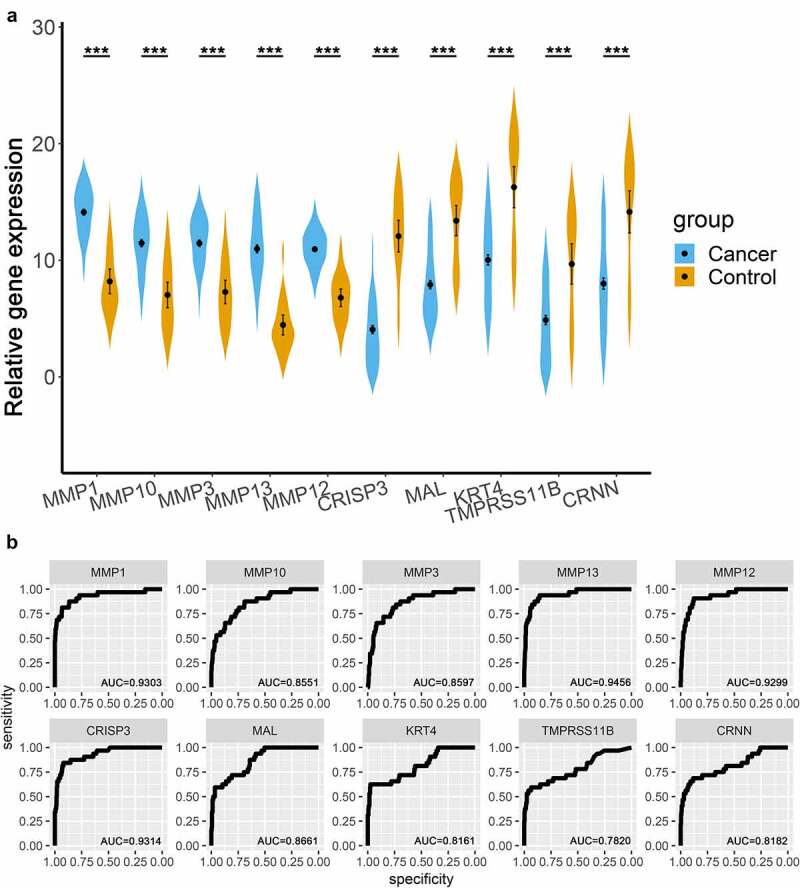
Figure 4.

Validation of the top 10 integrated DEGs in the TCGA OSCC cohort. (a). Violin plots, relative gene expression = log2(count+1); (b). ROC curves of the expression of MMP1, MMP10, MMP3, MMP13, MMP12, CRISP3, MAL, KRT4, TMPRSS11B, and CRNN. *** represented that p value < 0.001
