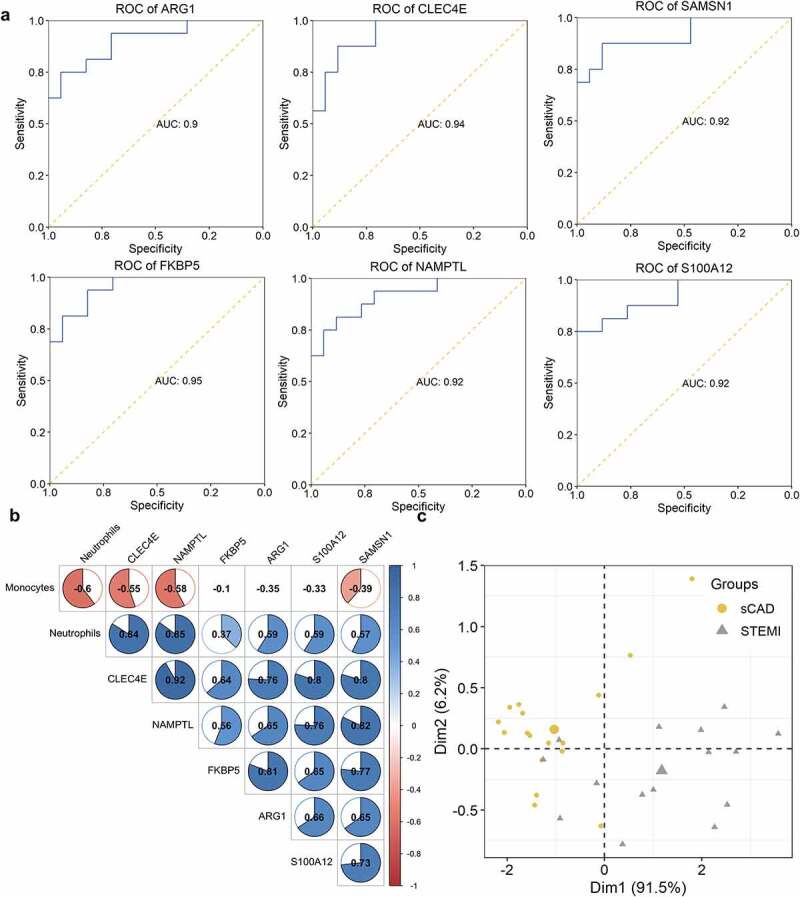
Figure 3.

ROC and correlation analysis of DEGs. (a) ROC analysis of DEGs in identifying patients with STEMI. The potential of DEGs in separating patients with STEMI from SCAD. (b) Correlation between DEGs and immune cell distribution. The diagram visualized the correlation matrix of DEGs, neutrophils, and monocytes distribution; the correlation was represented with color from −1 (red) to 1 (blue); blank boxes indicated the correlation was not significant (P > 0.01); (c) PCA with the expression of CLEC4E and NAMPTL and neutrophils distribution
