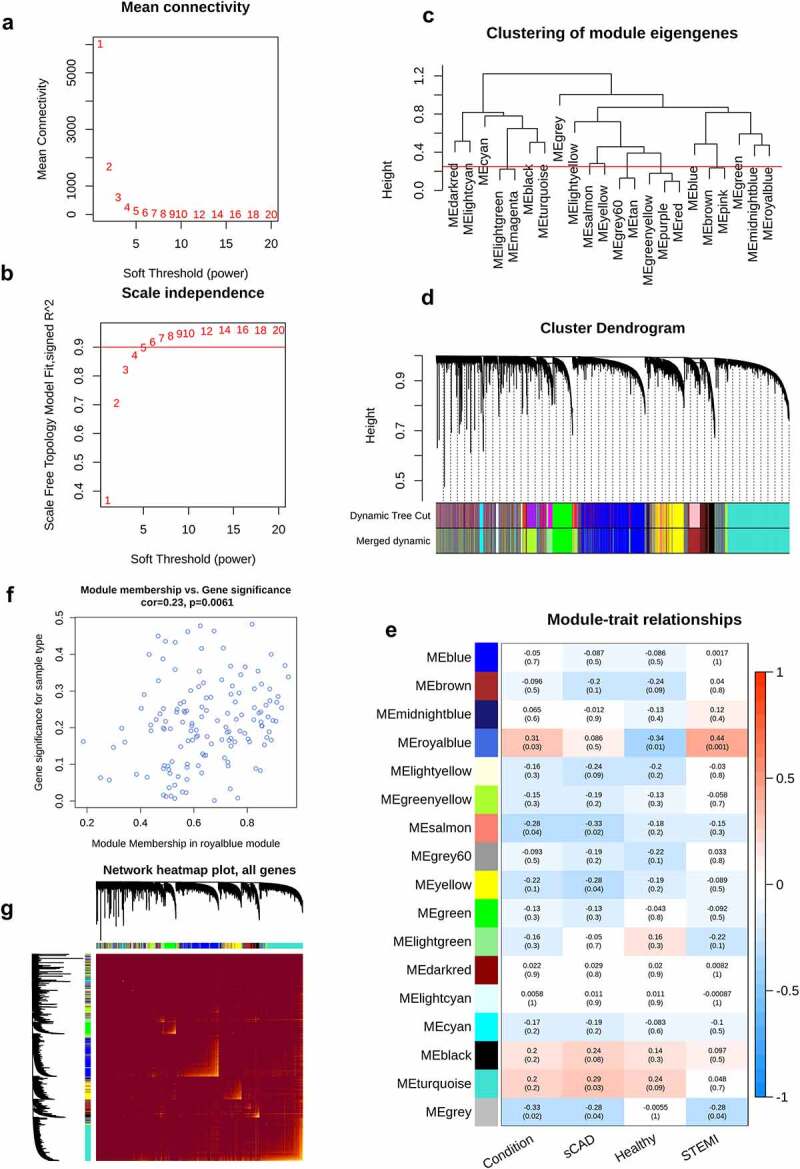
Figure 4.

WGCNA analysis of STEMI. The mean connectivity and scale independence value as a function of soft threshold (power) were depicted (a, b); the red line indicated the cutoff of scale independence of 0.9. (c) Clustering dendrogram of modules; red line indicates the threshold of merging modules. (d) Modules before or after merging and clustering. (e) The heatmap depicted the correlation scores (digit in the box above) as well as its corresponding P-value (digit in the box below) of modules (rows) and clinical traits (columns). The correlation of module membership and gene significance, as well as the correlation among all genes, were visualized in (f) and (g)
