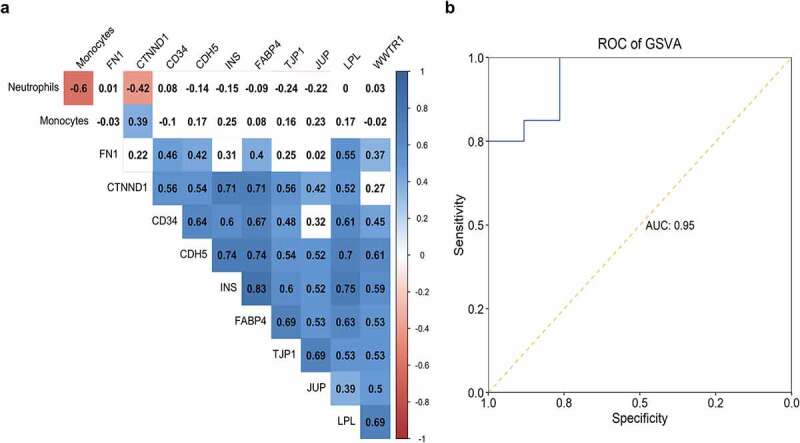
Figure 9.

Correlation of hub genes and distribution of two immune cells. The correlation table indicated the association of gene expression and fractions of monocytes and neutrophils; the correlation was color-coded from −1 (red) to 1 (blue); association without significance (P-value > 0.01) was blank. (b) The capability of GSVA index of ARG1, NAMPTL, and FN1 expression and neutrophils distribution in identifying patients with STEMI from SCAD was depicted
