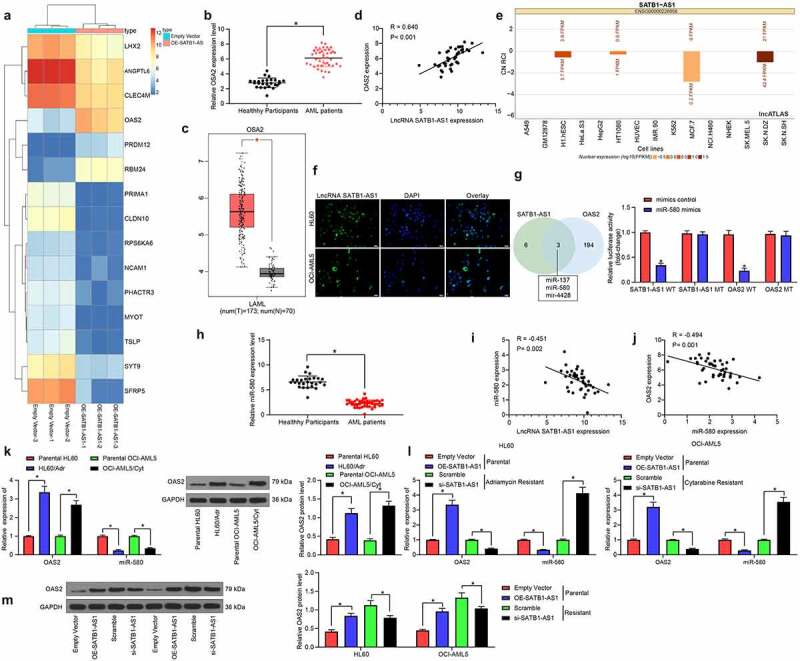
Figure 4.

SATB1-AS1 promotes OAS2 expression by interacting with miR-580. (a) Transcriptome analysis of top 30 differentially expressed genes in HL60 cells overexpressing SATB1-AS1.; (b) The mRNA expression of OAS2 in PBMC from 26 healthy subjects and 43 AML patients measured by qRT-PCR. (c) OAS2 expression in AML in TCGA database predicted by a bioinformatics website GEPIA (http://gepia.cancer-pku.cn/index.html). (d) The correlation between SATB1-AS1 and OAS2 expression in AML patients analyzed by Pearson’s correlation test. (e) The subcellular localization of SATB1-AS1 predicted by LncAtlas (http://lncatlas.crg.eu/). (f) SATB1-AS1 subcellular localization in cytoplasm verified by FISH assay. (g) The relationship between SATB1-AS1, OAS2 and miR-580 was predicted by TargetScan and StarBase and verified by dual-luciferase reporter assays (h) The expression of miR-580 in PBMC from 26 healthy subjects and 43 AML patients measured by qRT-PCR. (i) The correlation between SATB1-AS1 and miR-580 expression in AML patients analyzed by Pearson’s correlation test. (j) The correlation between OAS2 and miR-580 expression in AML patients analyzed by Pearson’s correlation test. (k) The expression of OAS2 in HL60 and OCI-AML5 parental cells and drug-resistant cells assessed by qRT-PCR and immunoblotting. (l) The expression of OAS2 mRNA and miR-580 in HL60 and OCI-AML5 cells measured by qRT-PCR. (m) The protein expression of OAS2 in HL60 and OCI-AML5 cells measured by immunoblotting after overexpression or intervention of SATB1-AS1. Each assessment was done in triplicate with 3-time repetition to ensure minimum deviation; statistical data were measurement data, and described as mean ± standard deviation; unpaired t test (panels b and h) or two-way ANOVA (panels g, k–m) was applied to compare the differences between two groups or for multiple-group comparisons, followed by Tukey’s multiple comparisons test. * p < 0.05
