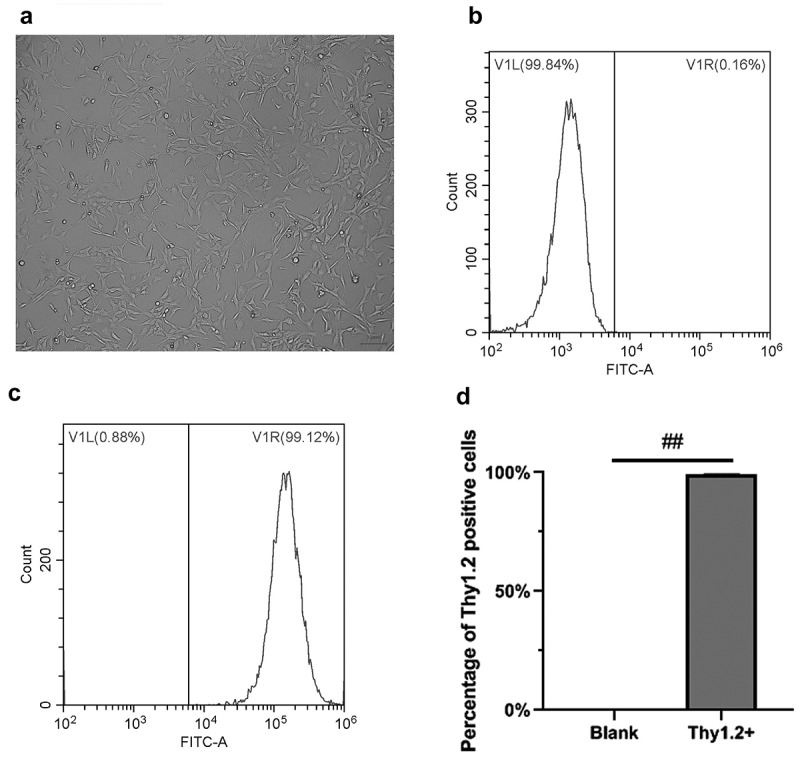
Figure 1.

Isolation and identification of RGCs in mice. A, RGCs in mice under white light. B, Unstained cells were used as a blank internal reference to eliminate systematic errors. C, Positive rate of Thy1.2 cells by flow cytometry, the Thy1.2 antibody labeled treatment group. D, Statistical chart of the results by flow cytometry. The scale bar is 100 microns. ##, p < 0.01
