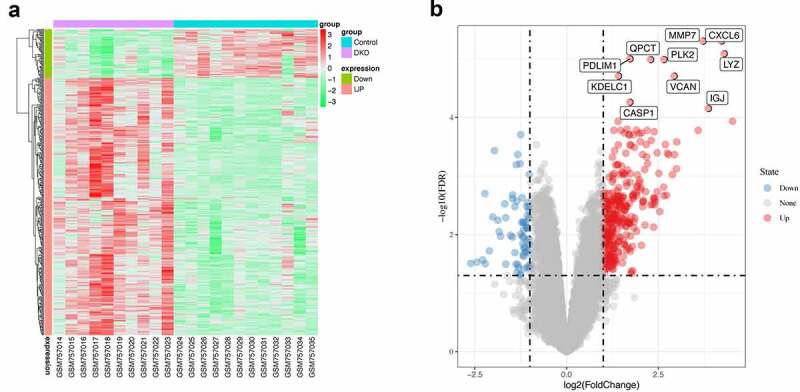
Figure 5.

Differentially expressed genes. (a) Heatmap of potential differentially expressed genes in the tubulointerstitium between DKD and control renal tissue. (b) Volcano plot of potential differentially expressed genes in the tubulointerstitium between DKD and control renal tissue. The top ten differentially genes are shown
