
Figure 3.
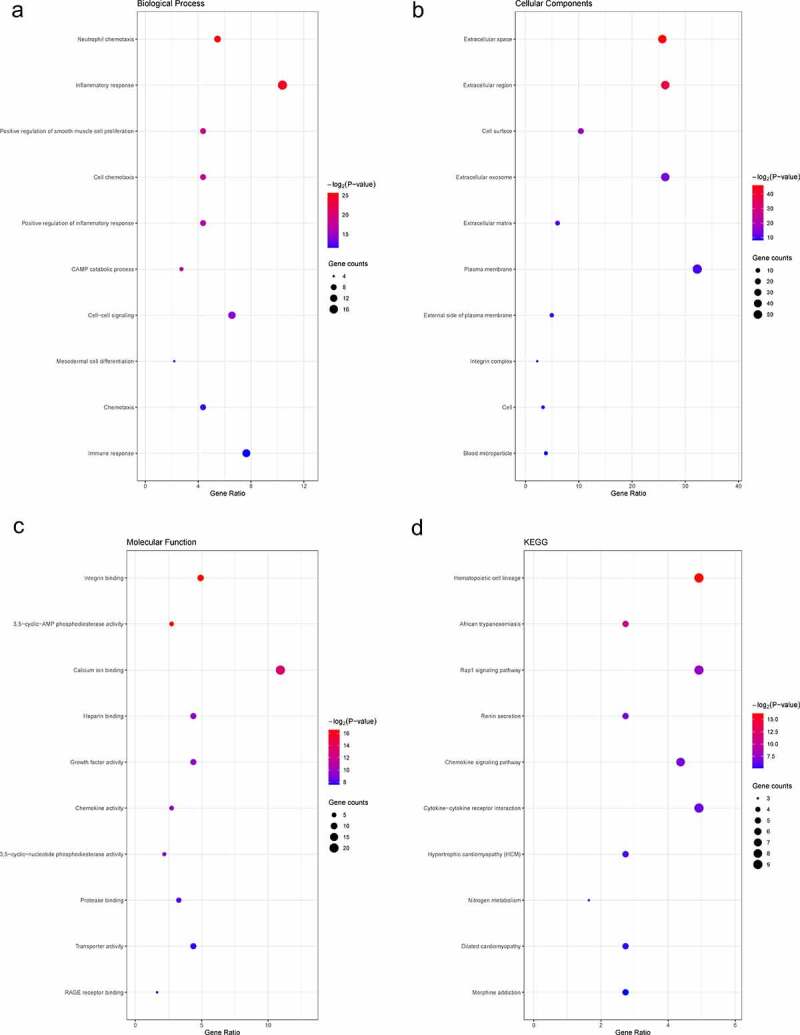
Top 10 enriched GO terms and top 10 KEGG pathways of differentially expressed genes. (A‑C) GO term enrichment analysis for (a) biological process, (b) molecular function, (c) cellular component. (d) KEGG pathway analysis. Node size represents gene ratio; node color represents P-value. GO, gene ontology; KEGG, Kyoto Encyclopedia of Genes and Genomes