
Figure 5.
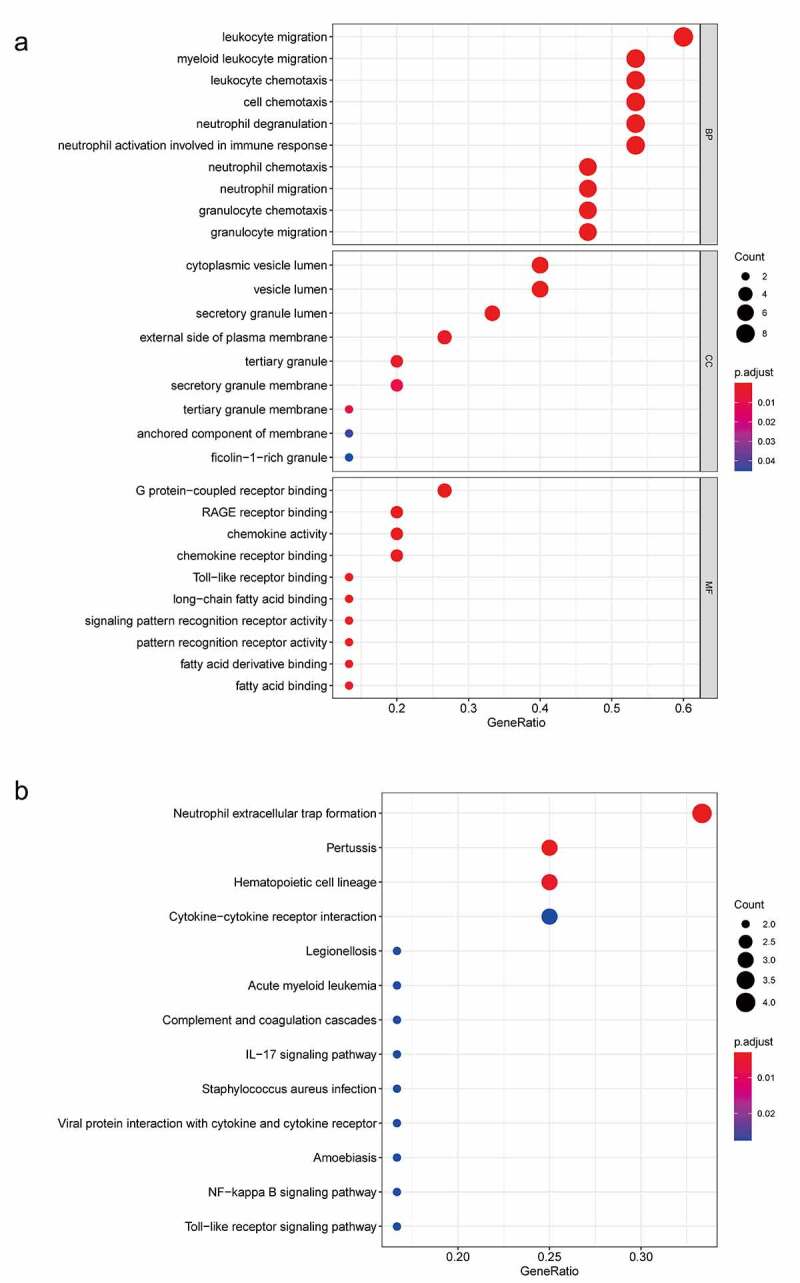
GO and KEGG analyses of module genes. (a) GO term enrichment analysis of module genes. (b) KEGG pathway analysis of module genes. Node size represents gene ratio; node color represents Padj-value. GO, gene ontology; KEGG, Kyoto Encyclopedia of Genes and Genomes