Figure 6.

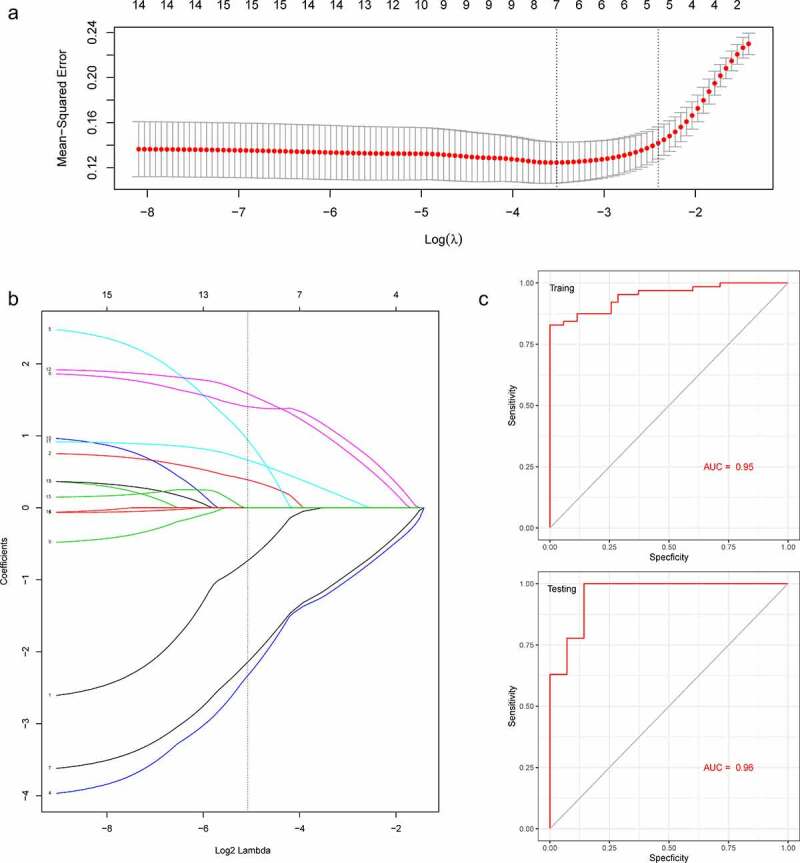
A model for predicting PAH. (a) LASSO model. (b) ROC curves analysis of training set. (c) ROC curves analysis of test set. AUC, area under the curve. PAH, Pulmonary arterial hypertension

A model for predicting PAH. (a) LASSO model. (b) ROC curves analysis of training set. (c) ROC curves analysis of test set. AUC, area under the curve. PAH, Pulmonary arterial hypertension