Figure 4.

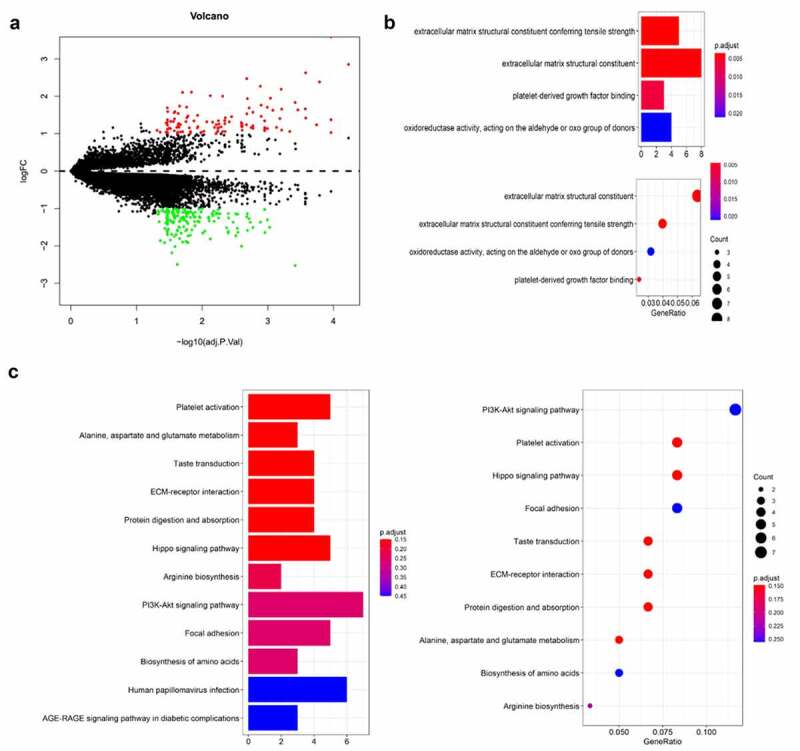
The differently expressed genes are shown by volcano map in TCGA (a). The KEGG and GO analysis are shown by bar and dot plot (b,c)

The differently expressed genes are shown by volcano map in TCGA (a). The KEGG and GO analysis are shown by bar and dot plot (b,c)