Figure 7.

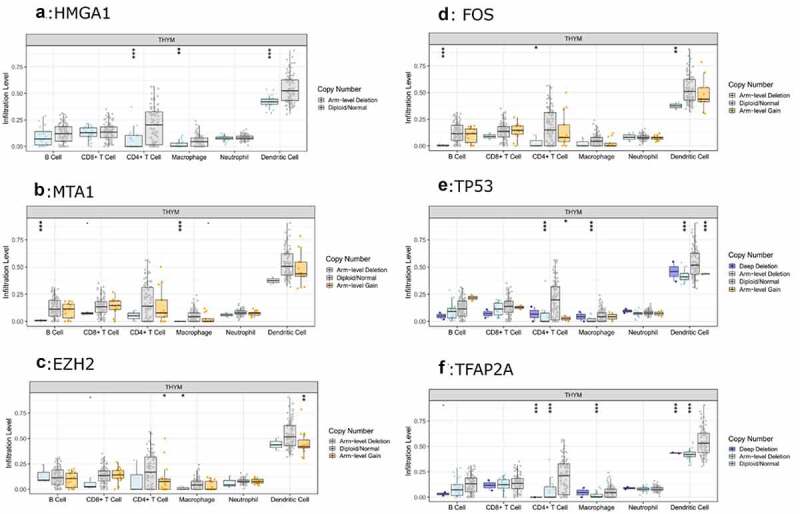
The relationship between the SCNA changes of HMGA1 (a), MTA1 (b), EZH2 (c), FOS (d), TP53 (e), TFAP2A (f) and the expression level of immune cells was verified by TIMER

The relationship between the SCNA changes of HMGA1 (a), MTA1 (b), EZH2 (c), FOS (d), TP53 (e), TFAP2A (f) and the expression level of immune cells was verified by TIMER