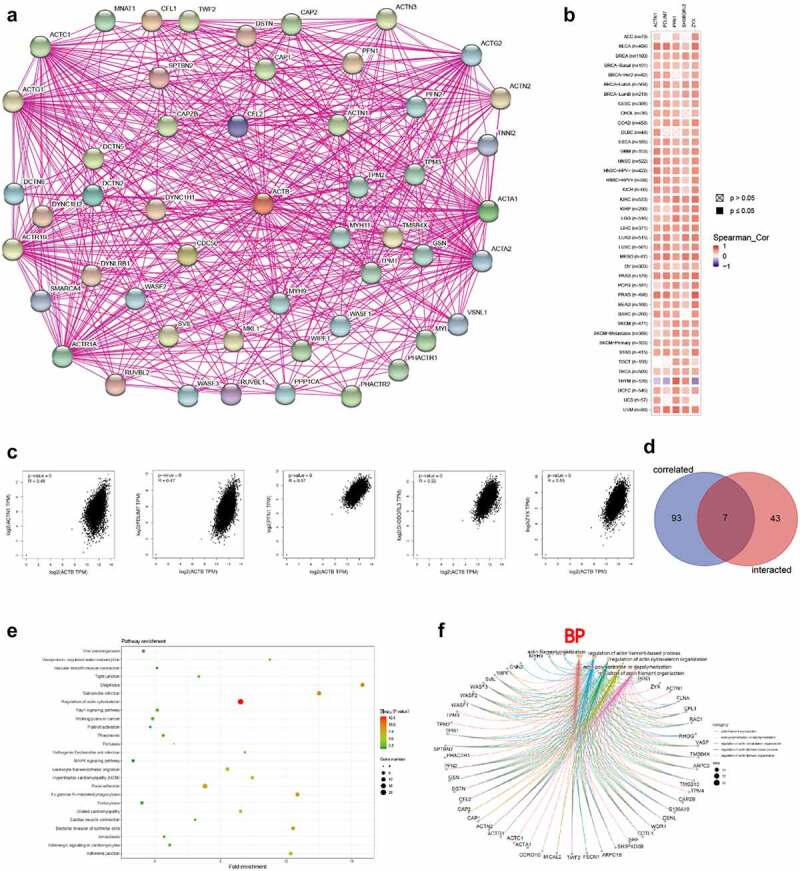
Figure 8.

ACTB-related gene enrichment analysis. (a) ACTB-interacted proteins from STRING. (b) Heatmap of the expression correlation between ACTB and ACTN1, PDLIM7, PFN1, SH3BGEL3, ZYX in cancers utilizing TIMER2. (c) The expression correlation between ACTB and ACTN1, PDLIM7, PFN1, SH3BGEL3, ZYX utilizing GEPIA2. (d) Venn diagram of the ACTB-interacted and correlated genes. (e) KEGG pathway analysis based on the ACTB-interacted and correlated genes. (f) The cnetplot of the biological process from GO analysis
