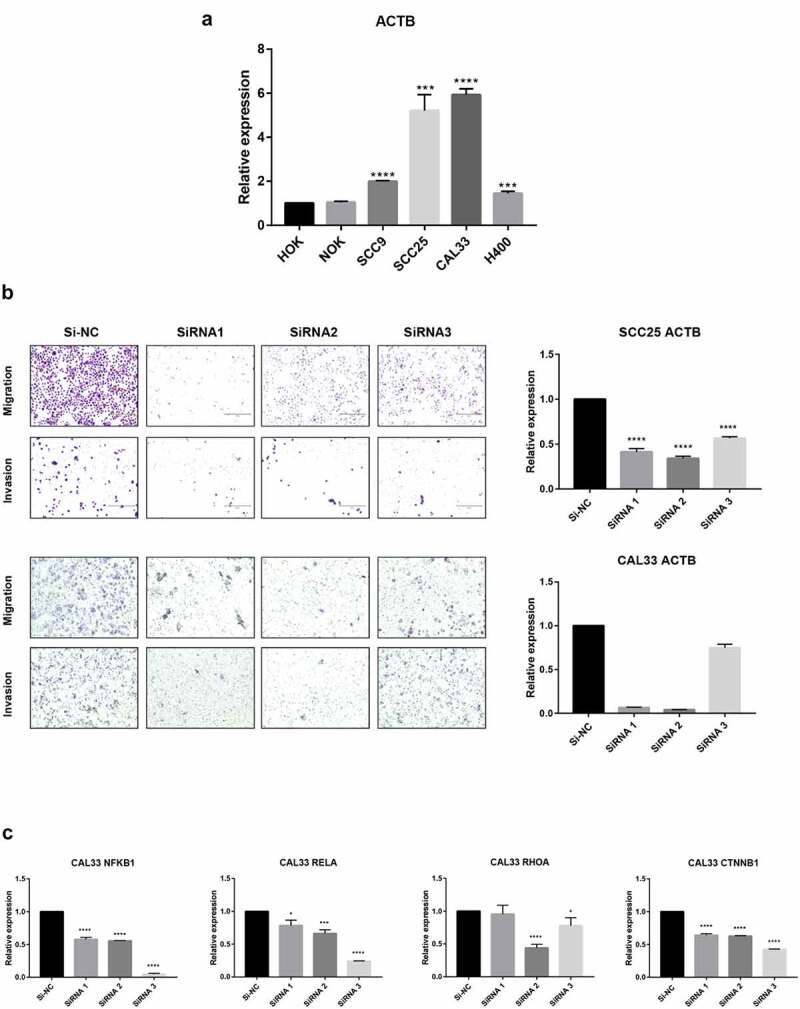
Figure 9.

Validation of ACTB mRNA expression and function in HNSC. Normal head and neck cell lines include HOK and NOK and HNSC cell lines include SCC9, SCC25, CAL33 and H400. * P < 0.05; ** P < 0.01; ***P < 0.001; ****P < 0.0001. (a) Comparison of ACTB mRNA expression between normal head and neck and HNSC cell lines. (b) Knockdown of ACTB restrained cell migration and invasion in SCC25 and CAL33 cells. (c) Knockdown of ACTB decreased the expression of NFKB1, RELA, RHOA and CTNNB1
