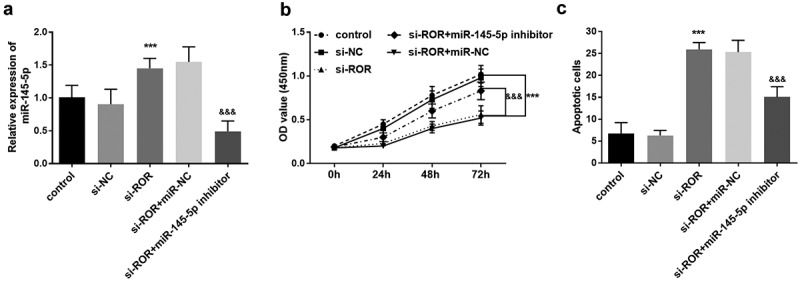
Figure 5.

(a) qRT-PCR results for the measurement of miR-145-5p levels in different cell groups. (b) CCK-8 assay results reflecting the cell proliferation in different groups. (c) Cell apoptosis evaluation using flow cytometry assay. *** P < 0.001, compared with control group; &&& P < 0.001, compared with si-ROR group. Differences among groups were compared using one-way ANOVA
