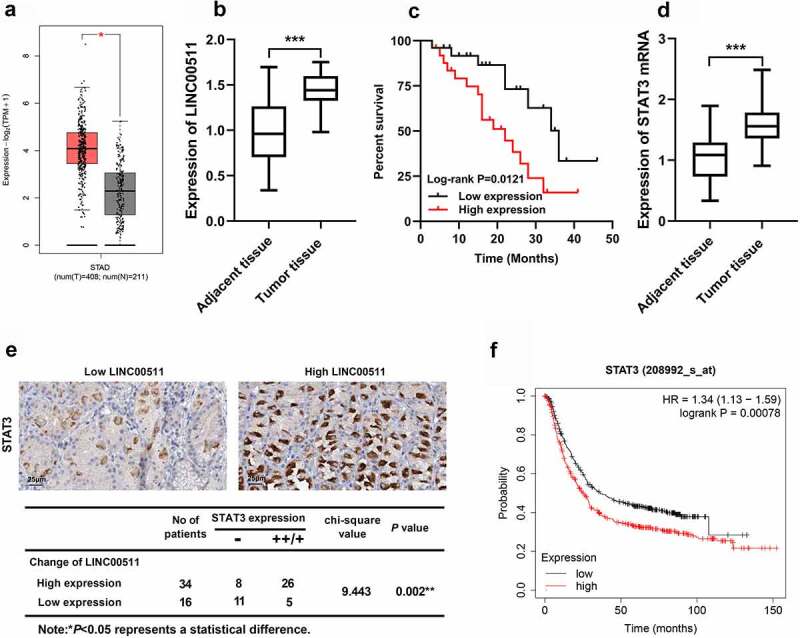
Figure 1.

LINC00511 and STAT3 expression characteristics in GC. A. The expression of LINC00511 in GC tissues was analyzed in the GEPIA database. B. LINC00511 expression in GC tissues was detected by qRT-PCR. C. Kaplan−Meier analysis of the correlation between LINC00511 expression level and the overall survival time of GC patients. D. STAT3 expression in GC tissues was detected by qRT-PCR. E. Immunohistochemical method was used to analyze the expression of STAT3 in GC samples, and two representative figures were shown (left: low LINC00511, weakly positive stain of STAT3; right: high LINC00511, strongly positive stain of STAT3), and chi-square test was used to analyze the correlation between STAT3 expression and LINC00511 expression in cancerous tissues. F. The Kaplan-Merier Plotter database was used to analyze the relationship between STAT3 expression and the overall survival time of GC patients
*P < 0.05, **P < 0.001, and ***P < 0.001.
