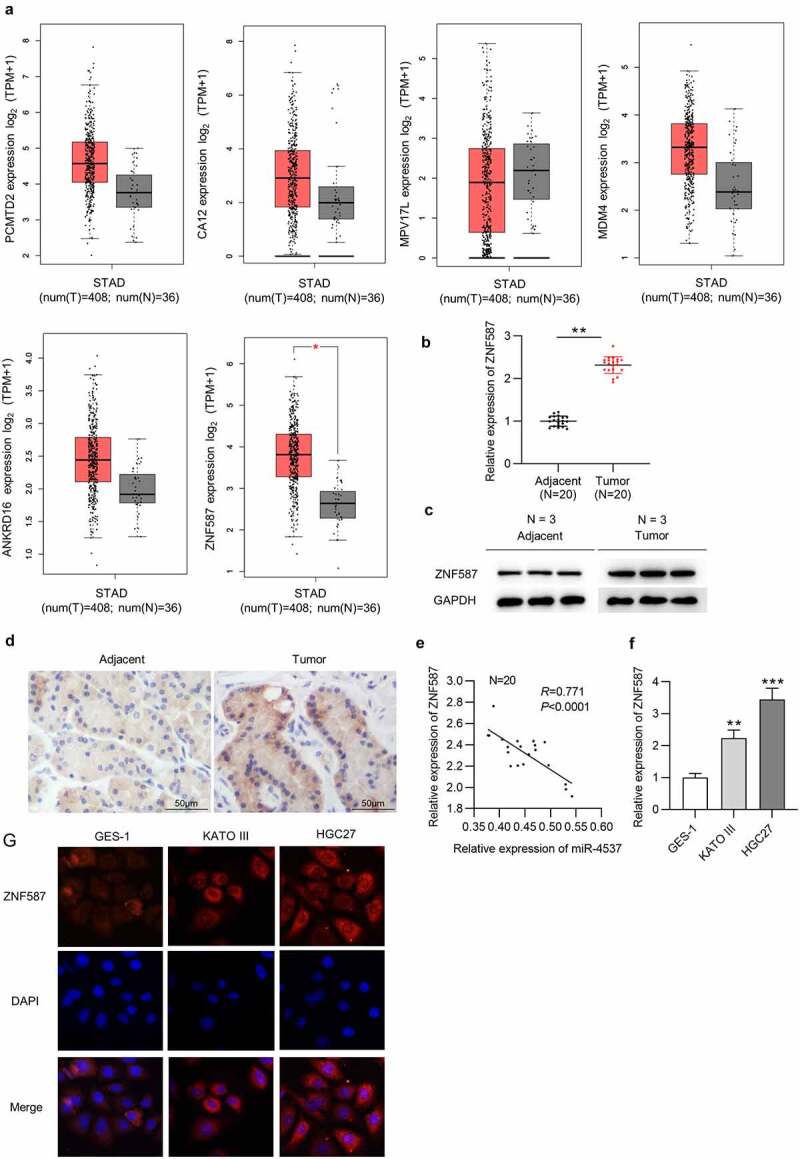
Figure 3.

ZNF587 is upregulated in GC tissues and cells
(a) GEPIA revealed the expression levels of PCMTD2, CA12, MPV17L, MDM4, ANKRD16, and ZNF587 in STAD. (b-c) RT-qPCR and western blotting showed the relative ZNF587 expression in GC tissues. (d) IHC showed ZNF587 expression in adjacent nontumor tissues and GC tissues. (e) Spearman rank correlation was used to study the relationship between miR-4537 and ZNF587 levels in GC. (f) RT-qPCR showed the relative miR-4537 expression in cell lines. (g) Immunofluorescence staining of ZNF587 in control GES-1 cells and GC cells. ** p < 0.01, *** p< 0.001.
