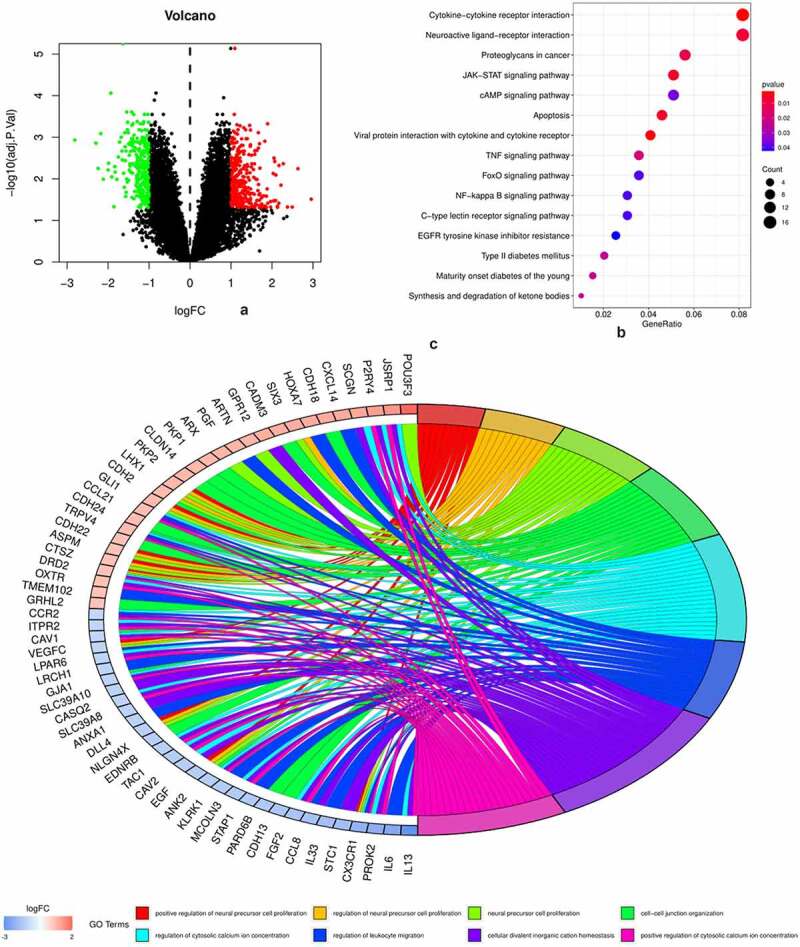
Figure 1.

DEGs and biofunctional analysis
Figure 1(a): Volcano plot of 587 DEGs, of which 321 were upregulated (red) and 266 were downregulated (green). Figure 1(b): Top 20 KEGG pathways enriched of the DEGs. Figure 1(c): Top eight gene ontology (GO) enrichments of the DEGs.
