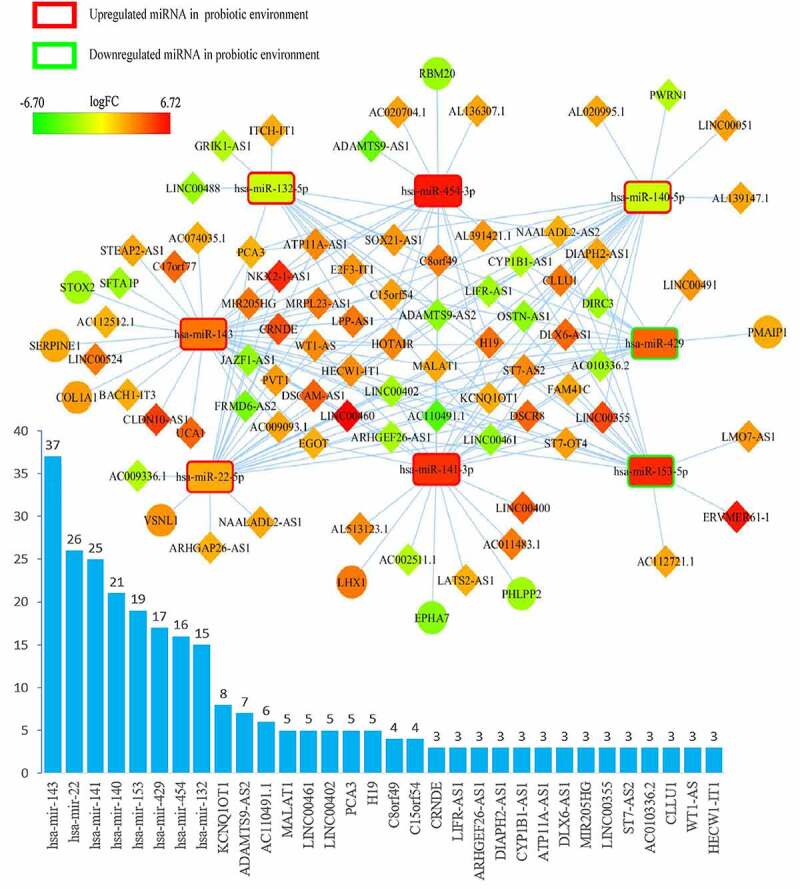
Figure 2.

Overview of lncRNA-miRNA-mRNA competing endogenous RNA (ceRNA) network in probiotics-mediated CRC. Red represents upregulation, and green represents downregulation. LncRNAs, miRNAs, and mRNAs in the networks are represented as diamonds, round rectangles, and circles, respectively. Bar plots show the key RNAs that have the top interaction number in the whole network
