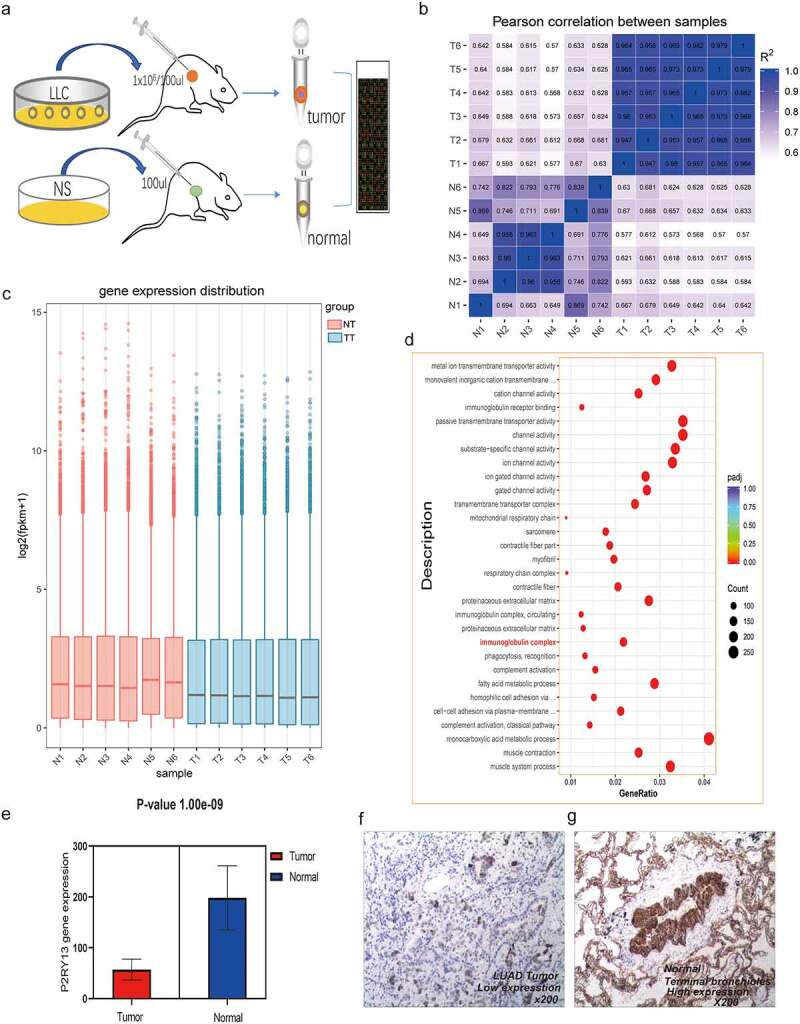
Figure 5.

Analysis of RNA-seq results based on C57BL/6 tumor-bearing model and P2RY13 verification. (a) Hematic diagram of the RNA-seq process in this study. (b) Pearson correlation analysis based on gene expression in tumor-bearing model and control group. As shown in the figure, the correlation between tumor models and normal tissues was relatively lower, and the differences between groups based on gene expression were more obvious. (c) The histogram of gene expression distribution in tumor-bearing model group and control group, the gene expression gene of tumor group is lower than that of normal group. (d) Enrichment analysis (KEGG) bubble chart based on DEGs between the two groups. As shown in the figure, DEGs were significantly enriched in pathways related to the immune process. (e) Differential expression of P2RY13 gene in C57BL/6 lung cancer tissues and normal tissues, the expression of P2RY13 in tumor tissues was significantly reduced (P < 0.001). (f-g) Expression of P2RY13 protein in human LUAD and normal alveolar tissue (X200, SP). LUAD: Lung adenocarcinoma; KEGG: Kyoto Encyclopedia of Genes and Genomes; DEGs: differentially expressed genes
