
Figure 6.
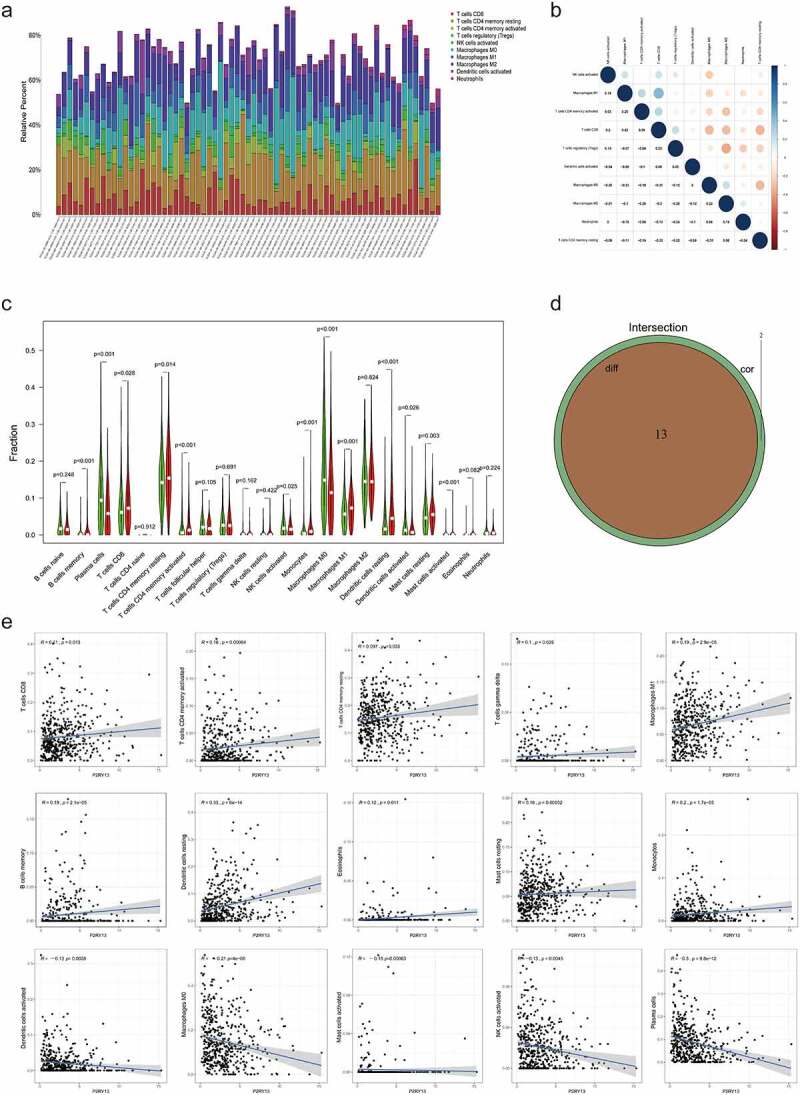
The expression profile of main TICs in LUAD tissues and the difference and correlation analysis with P2RY13 expression. (a) Barplot showing the proportion of main kinds of TICs in LUAD tumor samples. (b) Heatmap showing the correlation between the main TICs and numeric in each tiny box indicating the p value of correlation between two kinds of cells. (c) The violin plot showed the difference in the proportion of main TICs in the P2RY13 high expression and low expression groups. (d) Venn plot showed 13 kinds of TICs related to the expression of P2RY13 by correlation and difference analysis displayed in violin and scatter plots, respectively. (e) Analysis of the correlation between P2RY13 and 13 immune cells, which included eight TICs that were positively correlated with P2RY13 expression and five TICs that were negatively correlated with P2RY13 expression. TICs: tumor-infiltrating immune cells; LUAD: Lung adenocarcinoma