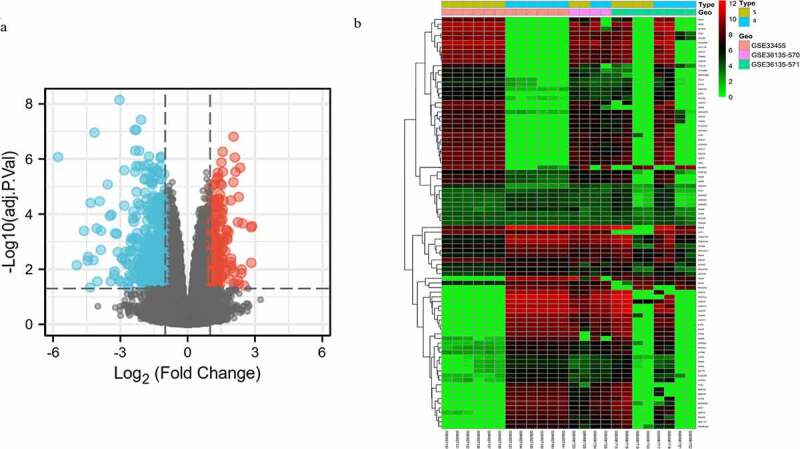
Figure 1.

Volcano plot distribution and heatmap of the DEGs. (a) Volcano plot of GSE33455 and GSE36135. The red points indicate upregulated DEGs, the blue points indicate downregulated DEGs, and the gray points indicate DEGs with no significant difference in expression; (b) DEG heatmap of GSE33455 and GSE36135. From red to green, the expression level of the genes in the samples gradually decreases. All DEGs are screened based on adj. P value < 0.05, |log2 FC | > 1. (DEGs, differentially expressed genes; S, docetaxel-sensitive; R, docetaxel-resistant)
