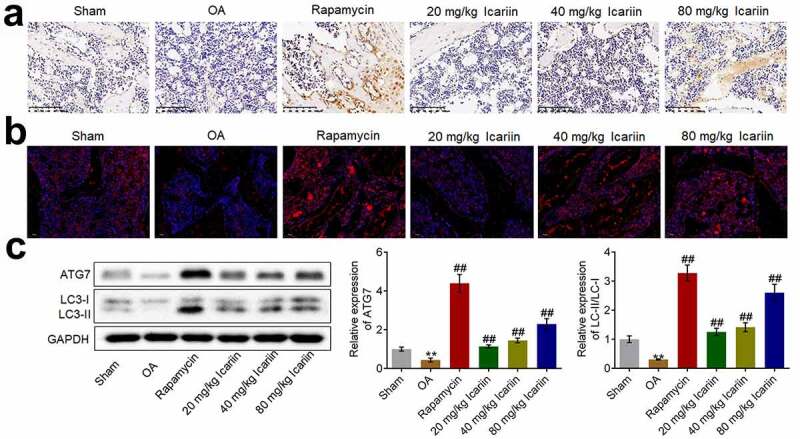
Figure 6.

Icariin activated autophagy in OA chondrocytes. (a). Beclin-1 expression level was measured using an immunohistochemical assay. Beclin-1 was upregulated in the rapamycin and icariin groups. (b). LC3 expression was visualized using an immunofluorescence assay. LC3 was upregulated in the rapamycin and icariin groups. (c). Western blotting was used to assess the expression of ATG7, LC3-I, and LC3-II in cartilage tissues. ATG7 and LC3-II/LC3-I levels were elevated in the rapamycin and icariin groups (**p < 0.01 vs. Sham, ##p < 0.01 vs. OA). Data are presented as means ± SD (n = 6)
