
Figure 8.
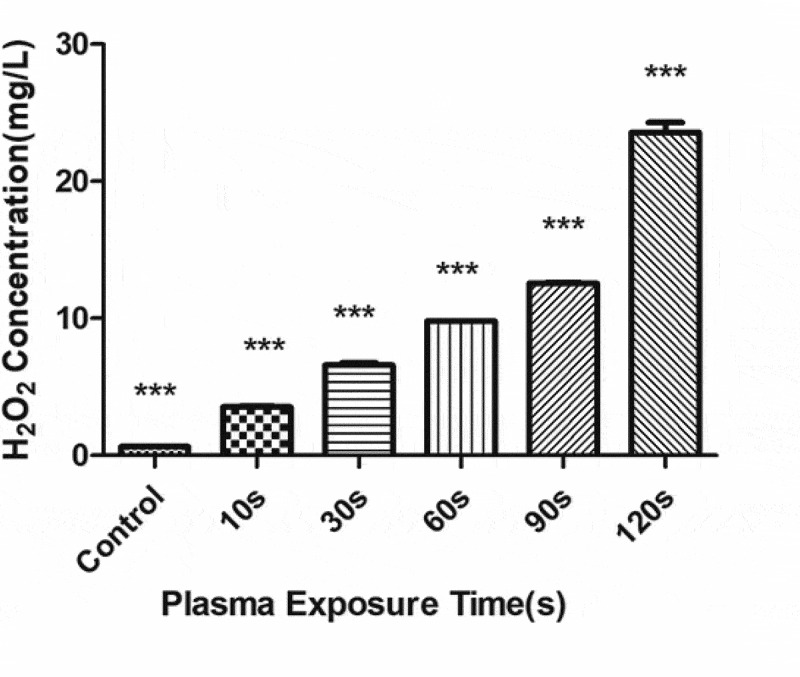
Changes in the H2O2 concentration in the plasma-activated liquid (PAL) treated for different periods (F = 718.5, P < 0.01)
Official websites use .gov
A
.gov website belongs to an official
government organization in the United States.
Secure .gov websites use HTTPS
A lock (
) or https:// means you've safely
connected to the .gov website. Share sensitive
information only on official, secure websites.
Changes in the H2O2 concentration in the plasma-activated liquid (PAL) treated for different periods (F = 718.5, P < 0.01)