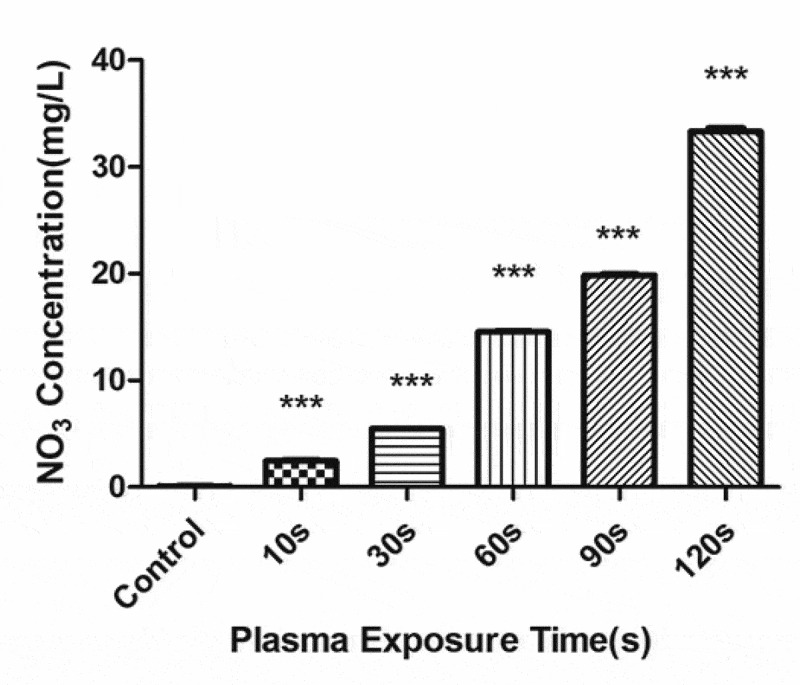
Figure 9.

Changes in the NO3 concentration in the plasma-activated liquid (PAL) treated for different periods (F = 7228, P < 0.01)

Changes in the NO3 concentration in the plasma-activated liquid (PAL) treated for different periods (F = 7228, P < 0.01)