
Figure 12.
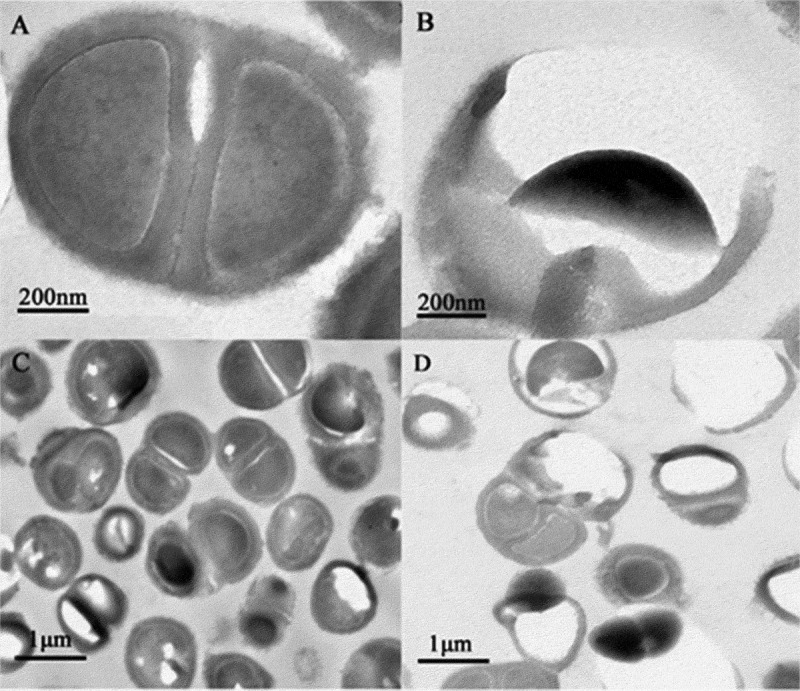
Changes in the bacterial structure photographed under an electron microscope. (a-d): a and c represent the control group, and b and d represent the treatment group after plasma-activated liquid treatment
Official websites use .gov
A
.gov website belongs to an official
government organization in the United States.
Secure .gov websites use HTTPS
A lock (
) or https:// means you've safely
connected to the .gov website. Share sensitive
information only on official, secure websites.
Changes in the bacterial structure photographed under an electron microscope. (a-d): a and c represent the control group, and b and d represent the treatment group after plasma-activated liquid treatment